Top Facts Summary
The International Federation of Robotics (IFR) published the World Robotics 2025 data on September 25th.
The annual report provides global statistics on
industrial robots and
service robots.
Industrial Robots
Service Robots
Press Photo Gallery
Industrial Robots
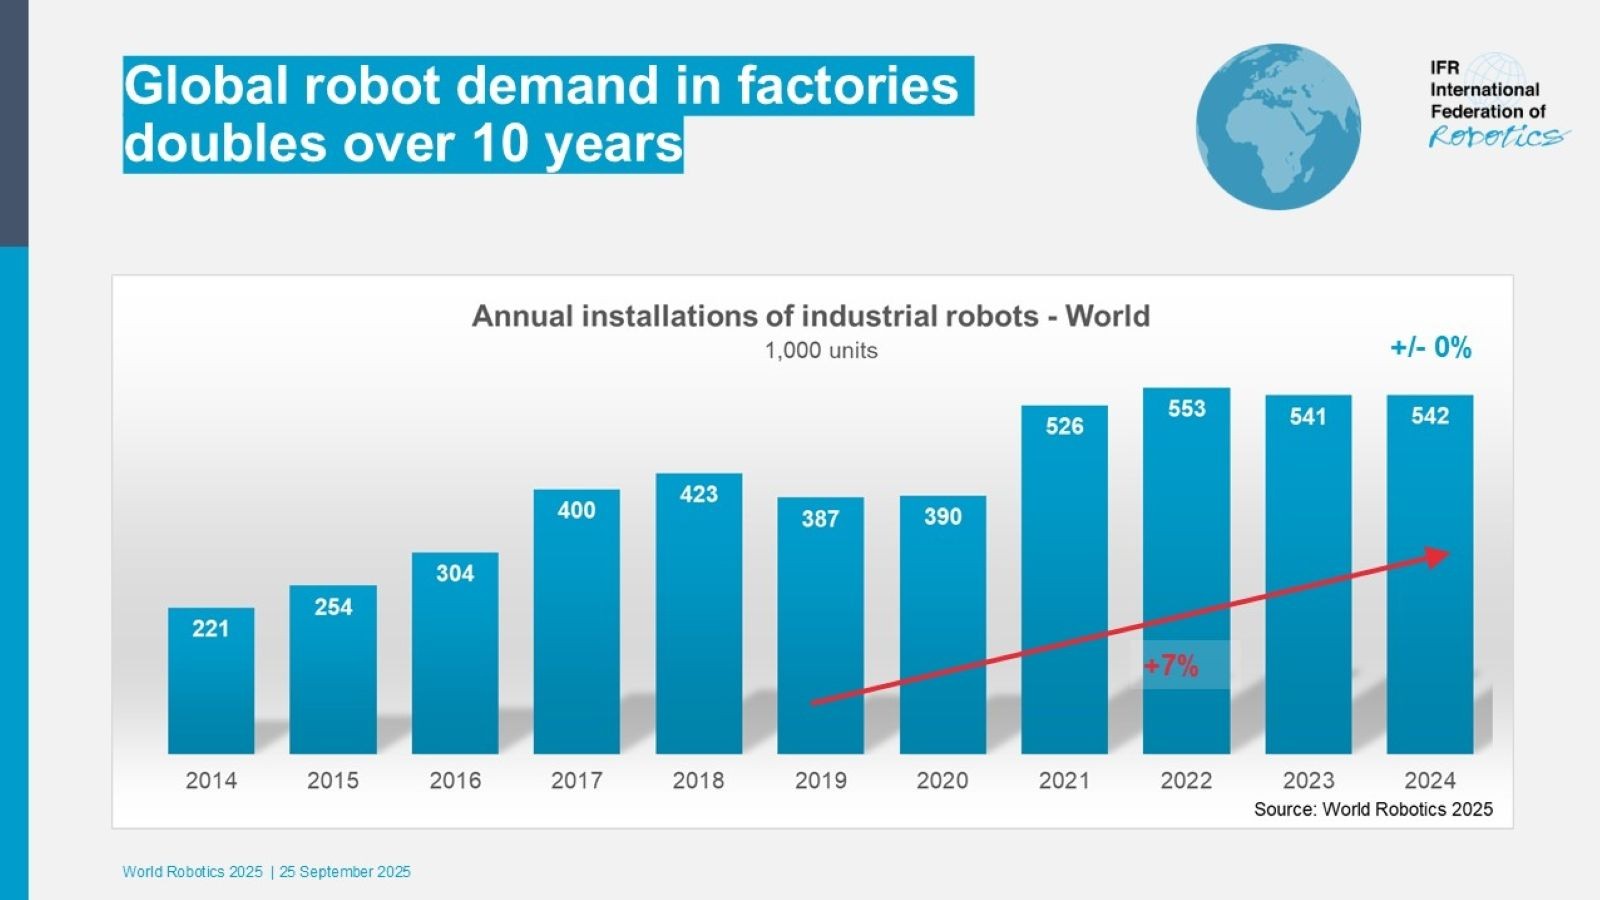
- 542,000 industrial robots were installed in 2024, more than double the number from 10 years ago. Annual installations topped 500,000 units for the fourth straight year.
- Asia accounted for 74% of new deployments in 2024, compared with 16% in Europe and 9% in the Americas.
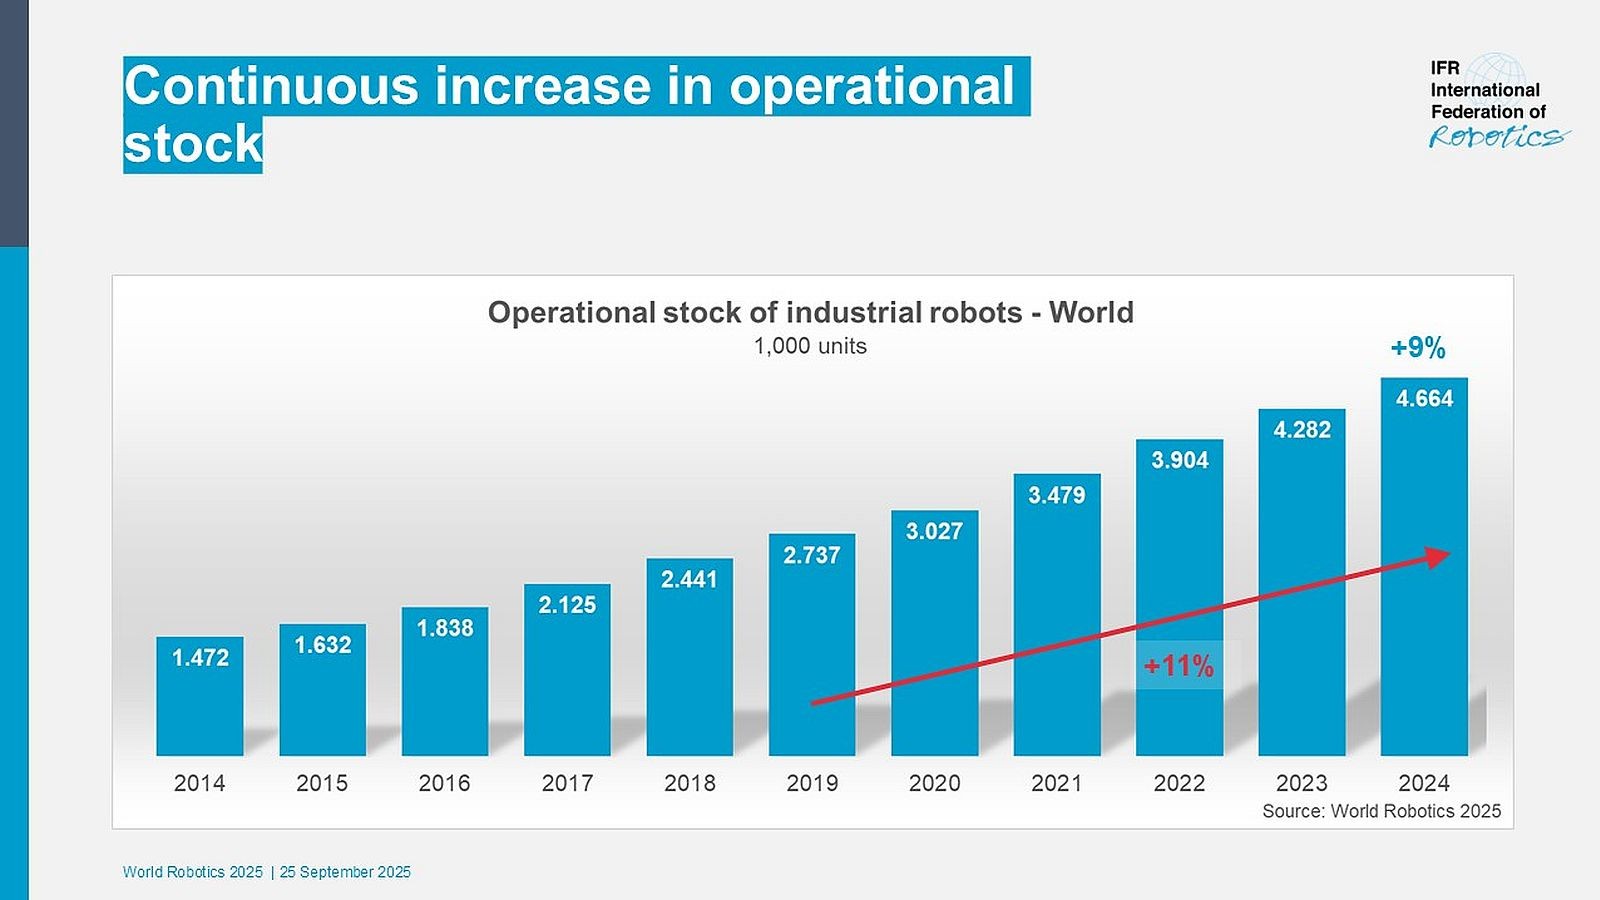
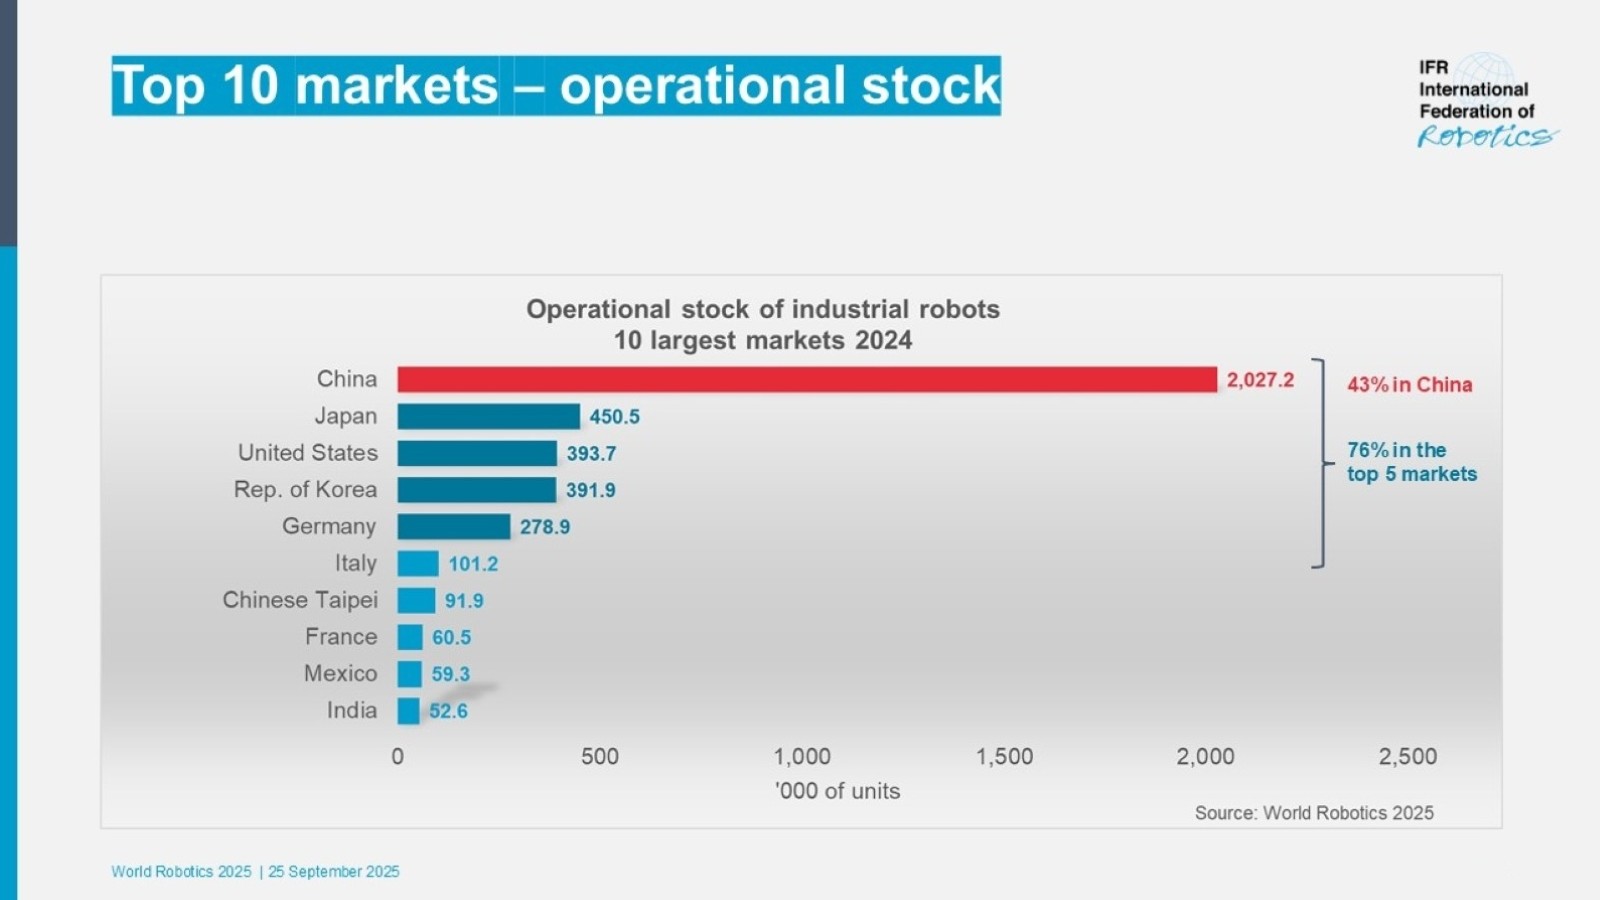
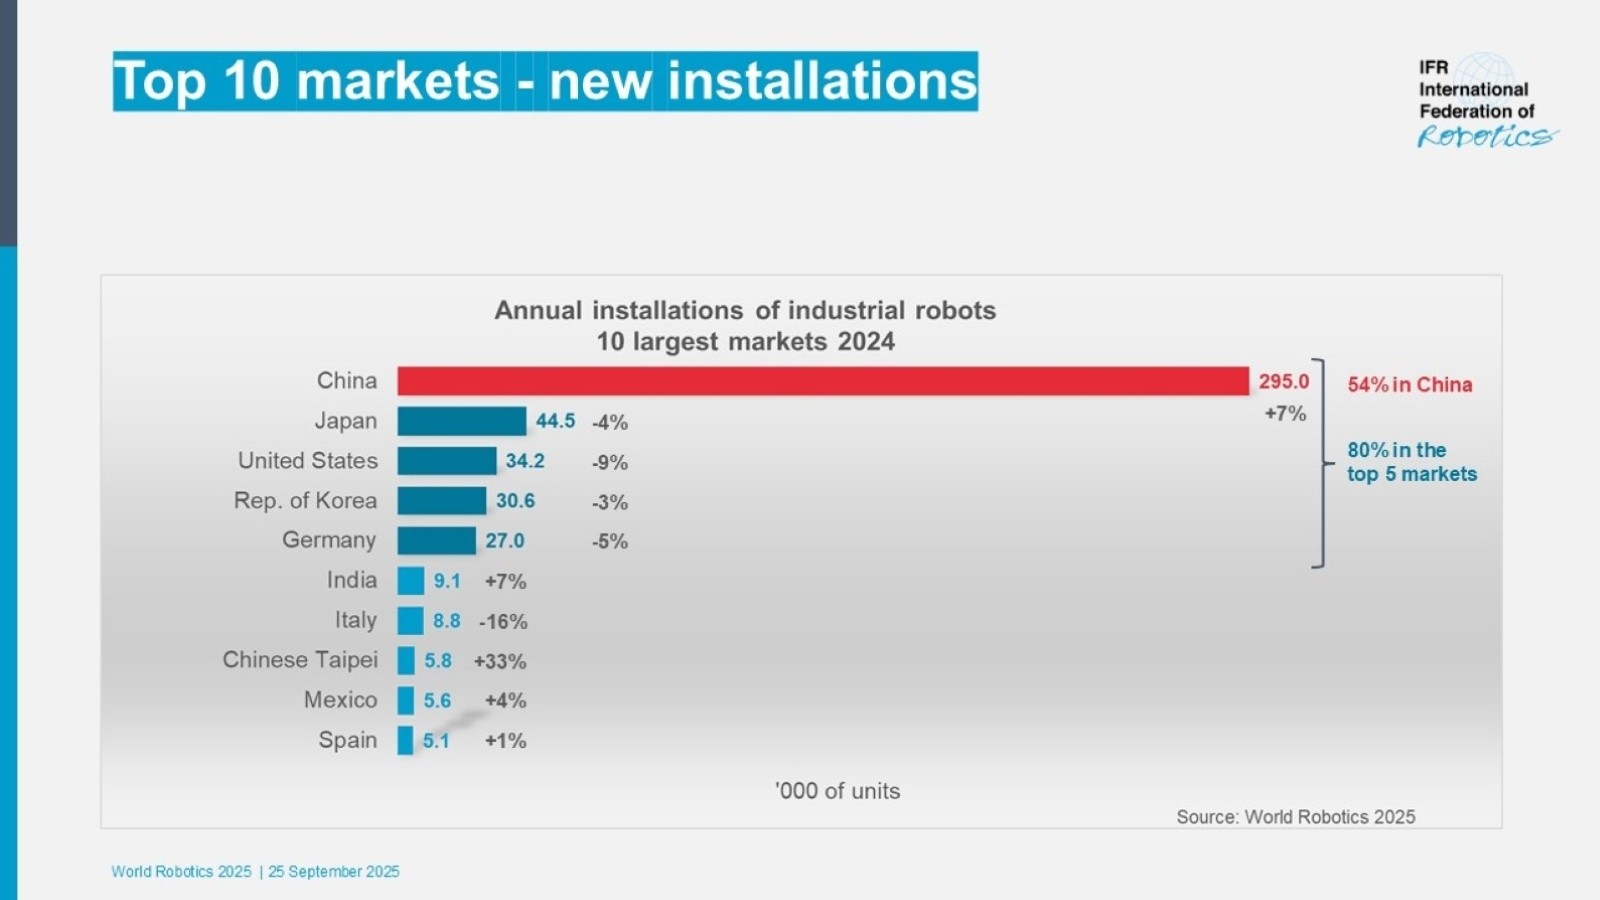
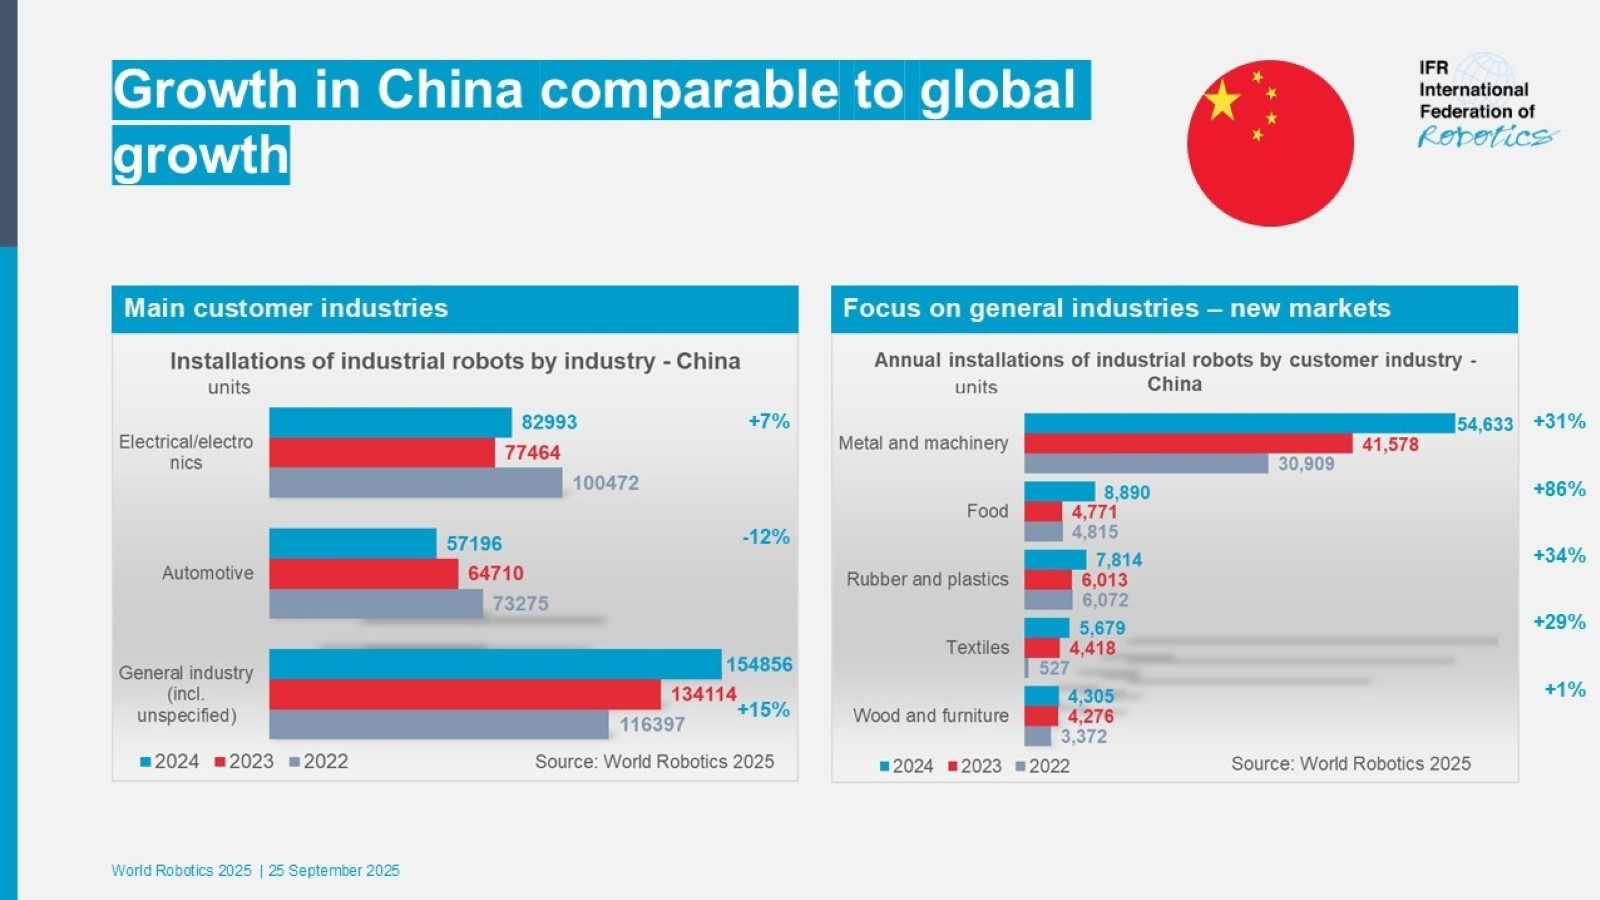
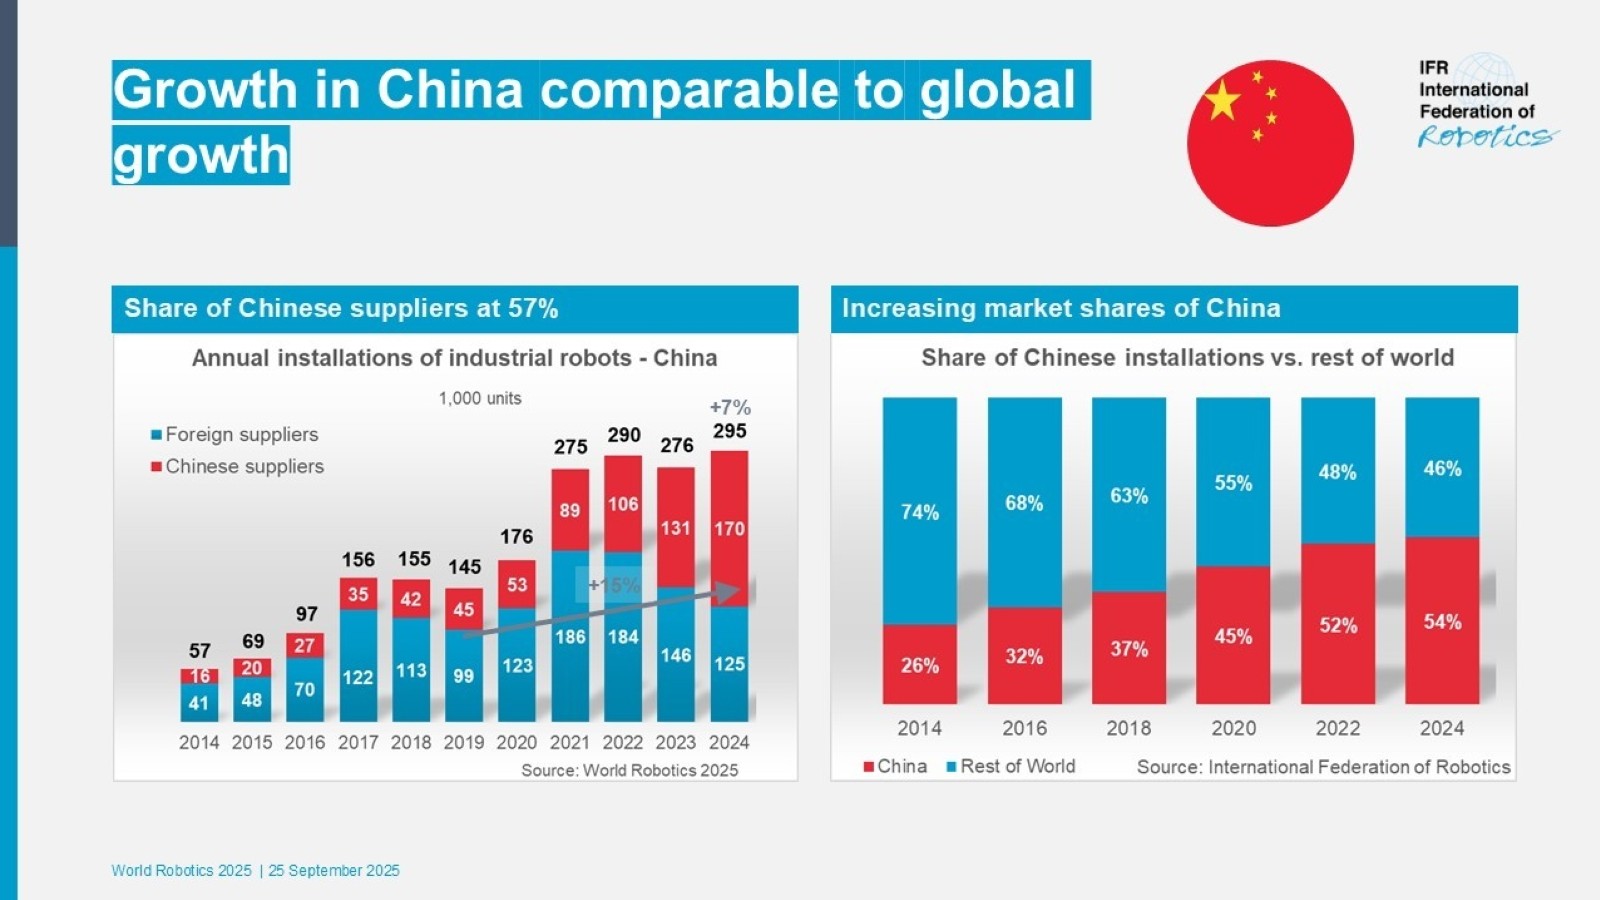
- China is by far the world’s largest market in 2024, representing 54% of global deployments. The latest figures show that 295,000 industrial robots have been installed - the highest annual total on record. For the first time, Chinese manufacturers have sold more than foreign suppliers in their home country. Their domestic market share climbed to 57% last year, up from about 28% over the past decade. China’s operational robot stock exceeded the 2 million mark in 2024, the largest of any country. As robotics in China is opening up new markets, there is no indication that robot demand in China will decrease. There is still a lot of potential in Chinese manufacturing for 10% growth on average each year until 2028.
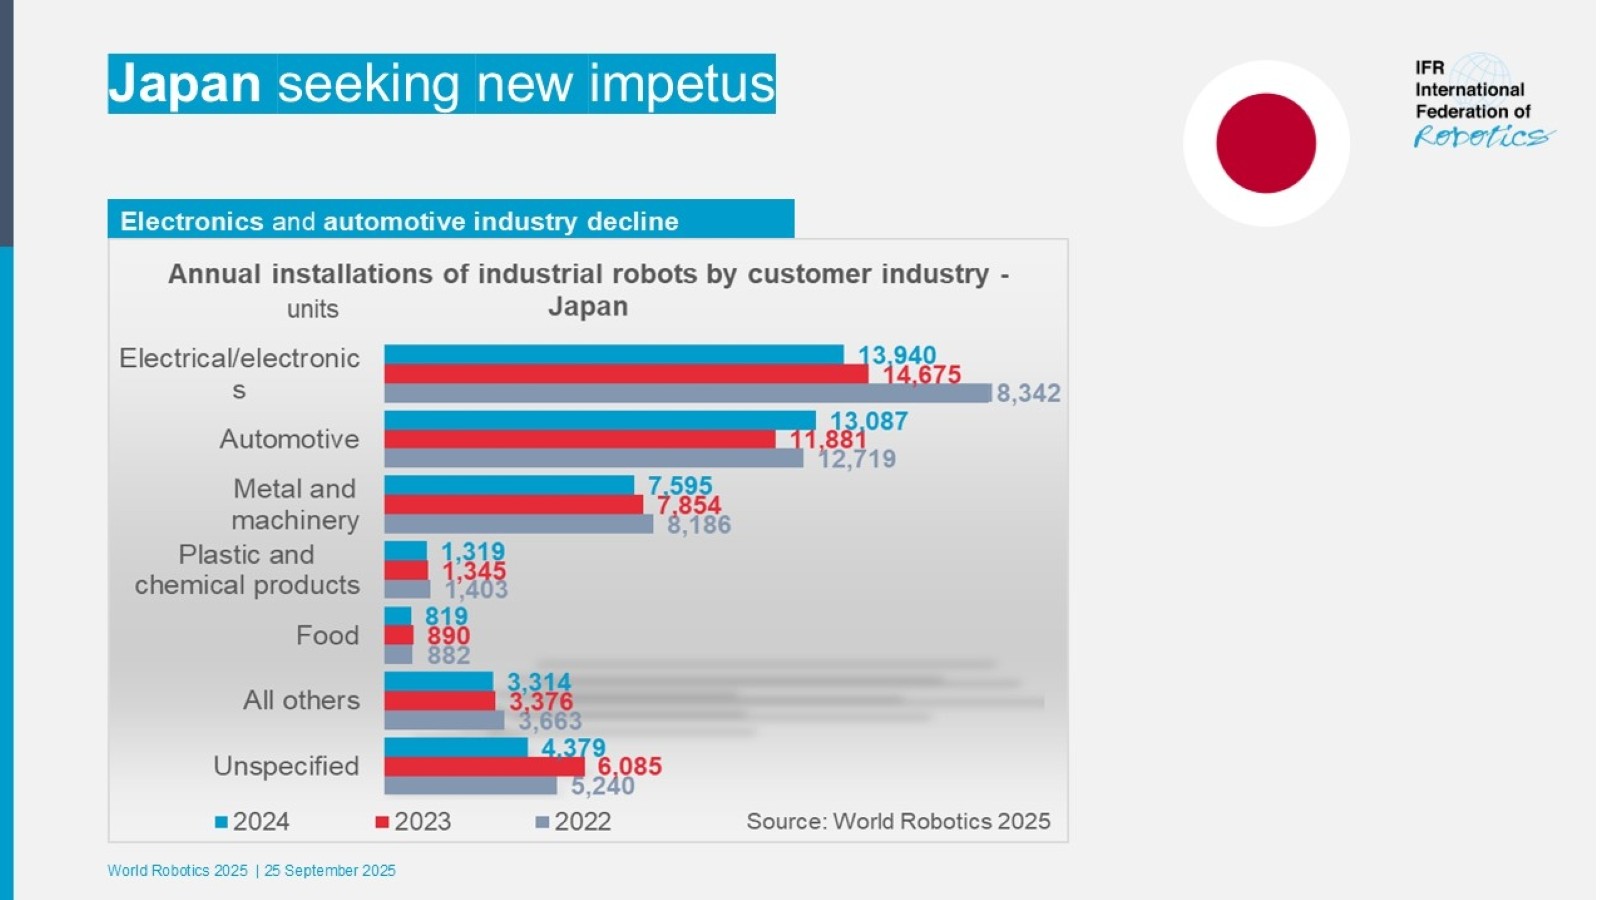
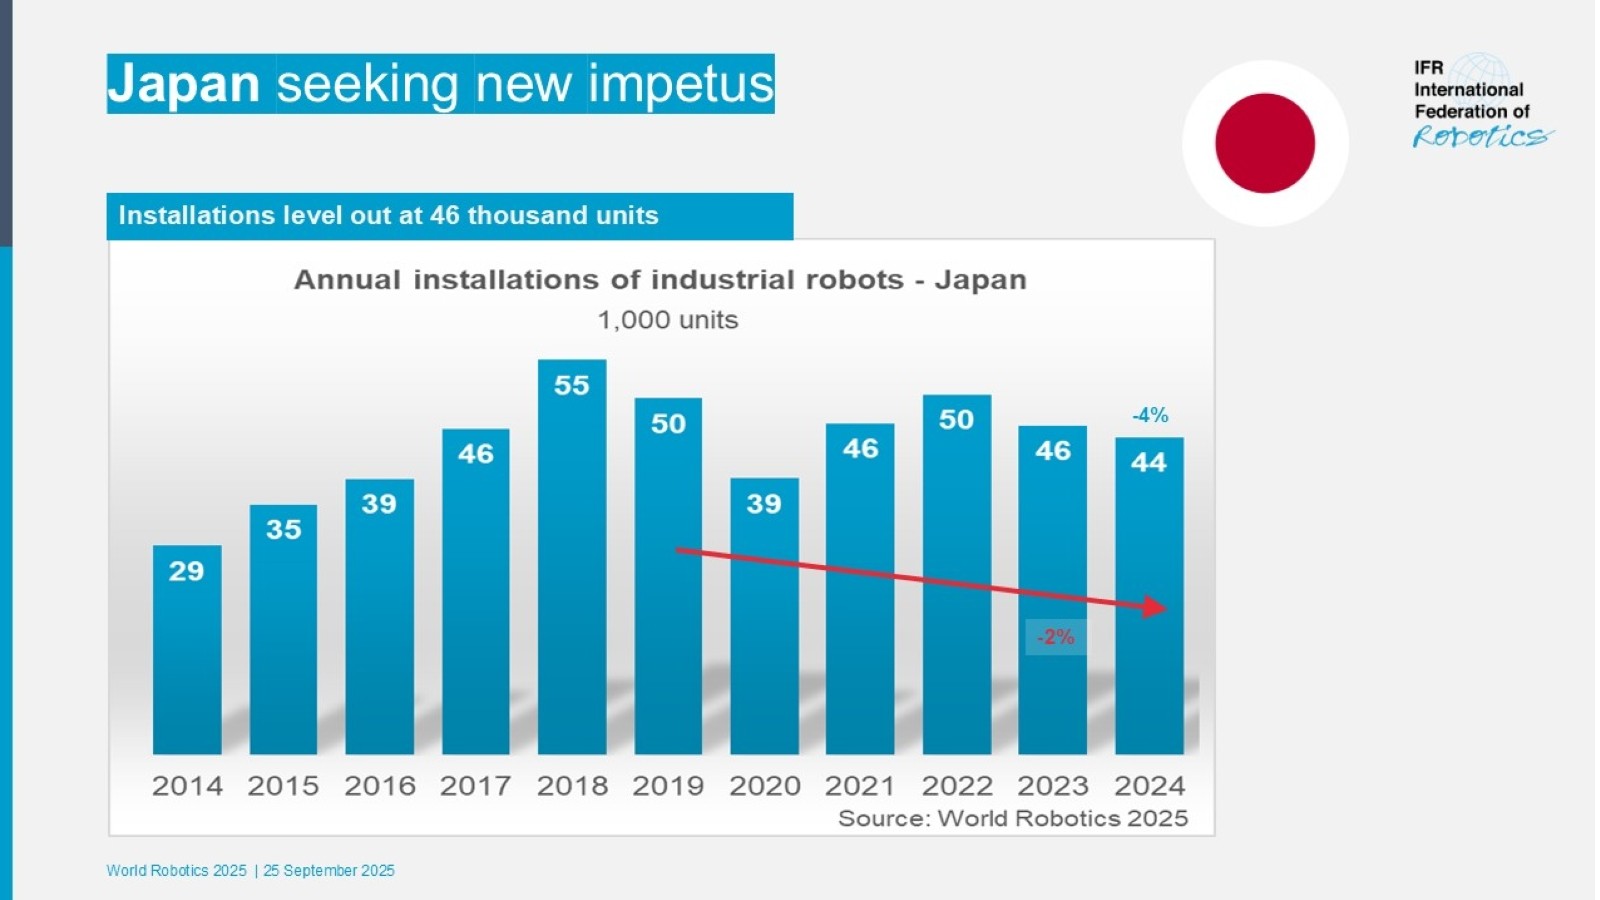
- Japan maintained its position as the second-largest market for industrial robots, with 44,500 units installed in 2024 – a slight 4% decrease. The country's operational stock rose by 3%, with 450,500 units now in use. Demand for robots will grow slightly by lower single-digit rates in 2025. It will then accelerate to a medium single-digit rate on average in the next few years.
- The market in the Republic of Korea: installed 30,600 units in 2024 – down 3%. Annual installations had been trending sideways of around 31,000 units since 2019. The country is the fourth largest robot market in the world in terms of annual installations in 2024, after the United States, Japan, and China.
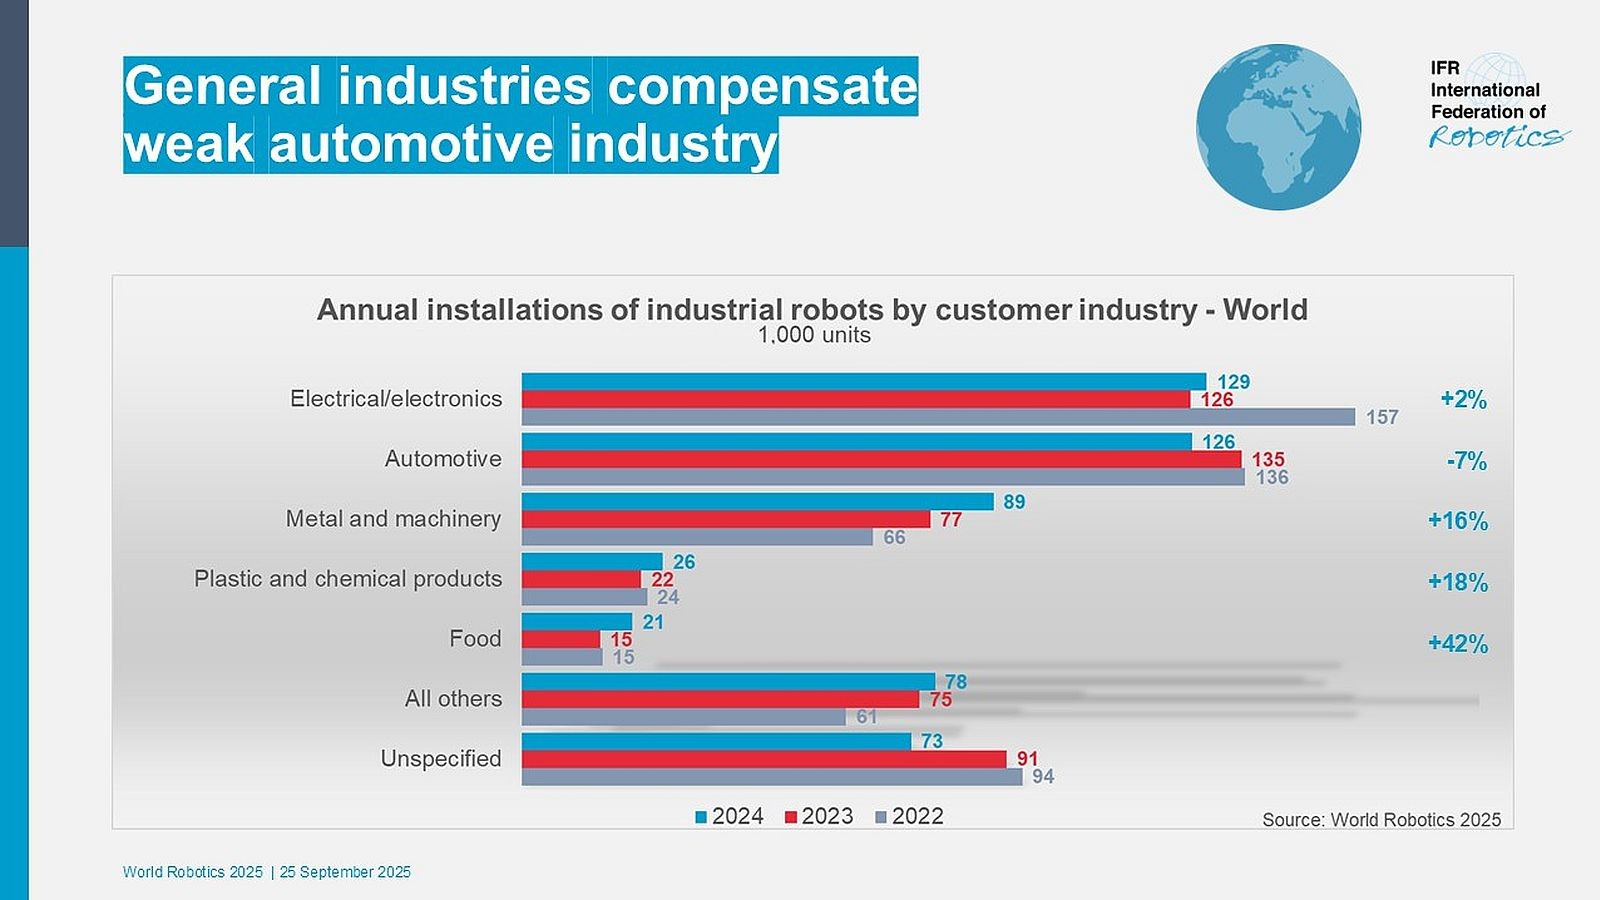
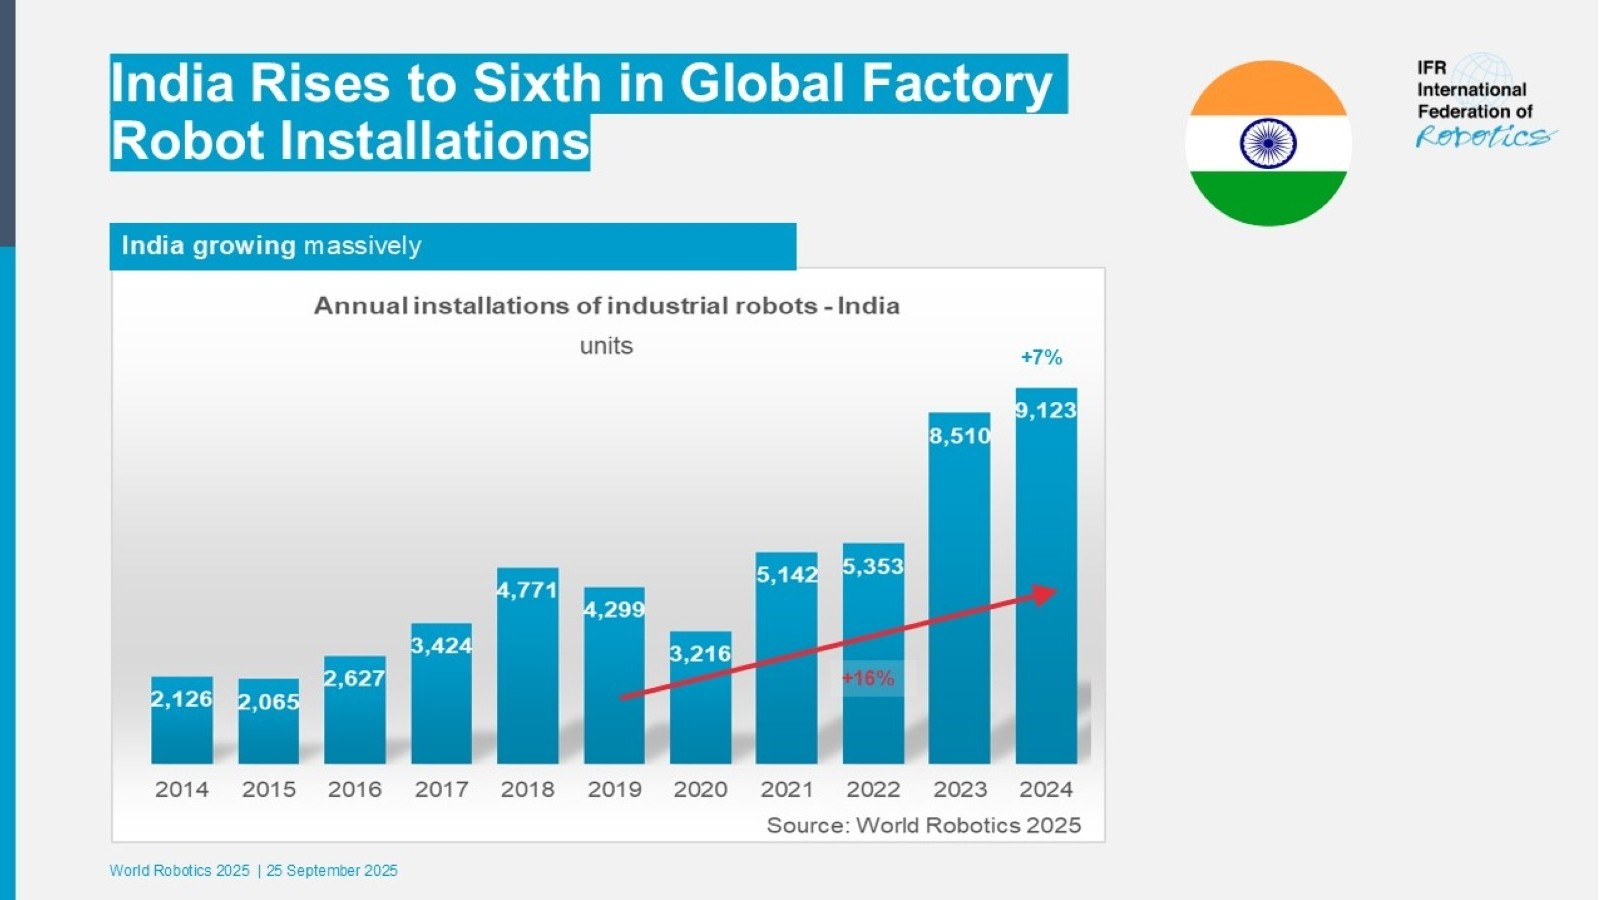
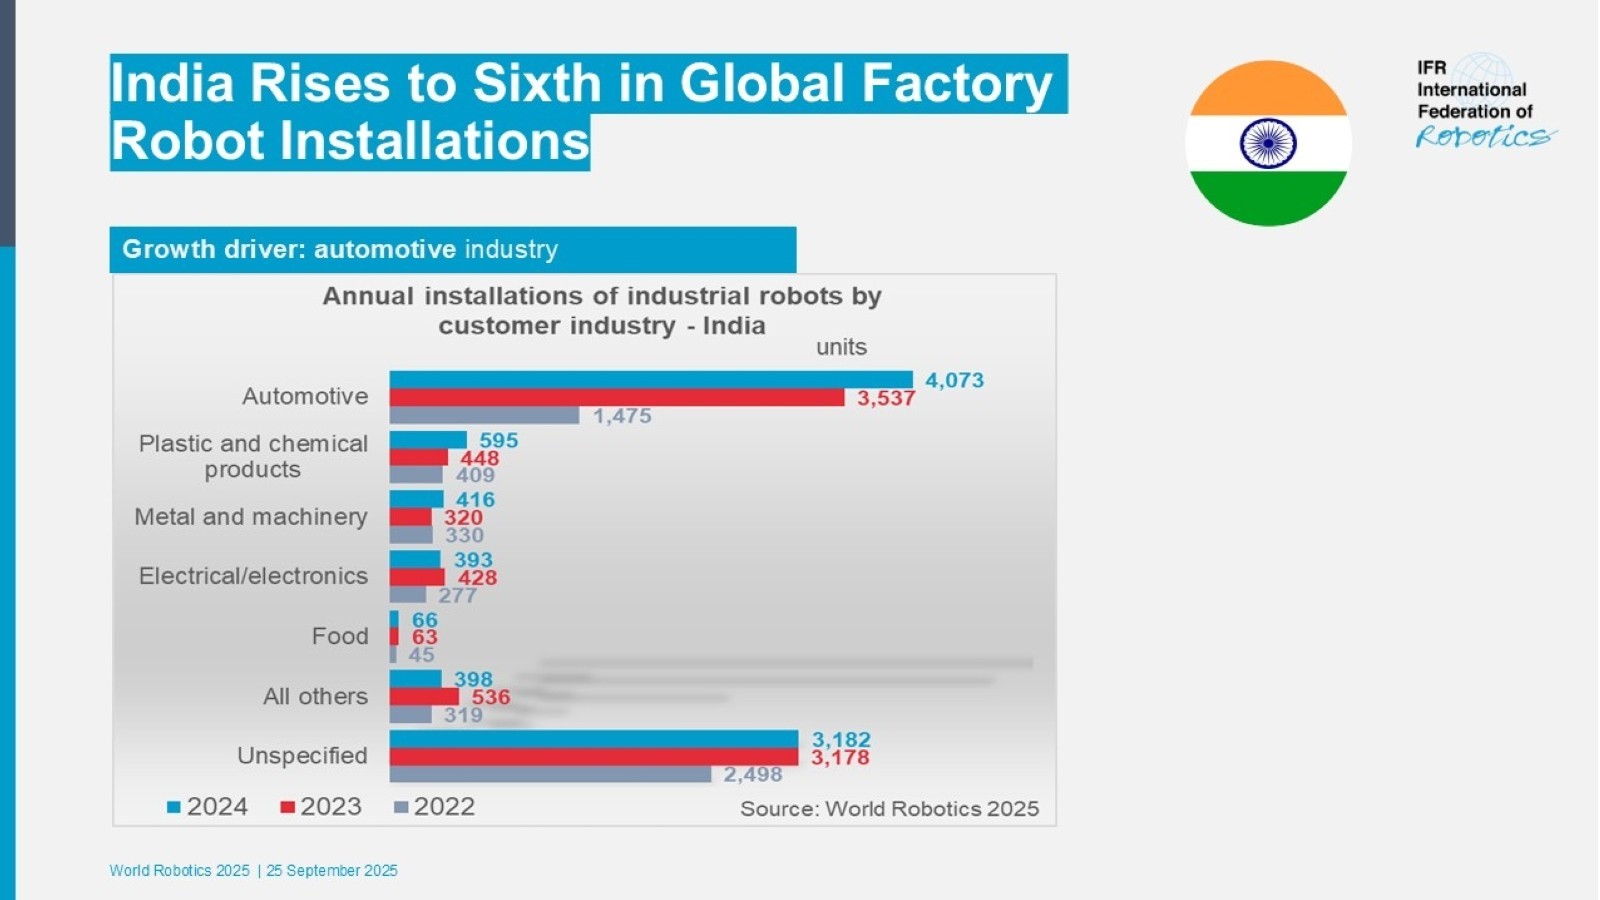
- India continues to grow with a record of 9,100 units installed in 2024 – up 7%. The automotive industry was the strongest driver with a market share of 45%. In terms of annual installations, India ranks sixth worldwide, one place up behind Germany.
- Industrial robot installations in Europe fell 8% to 85,000 units in 2024,
still the second largest number recorded in history.
80% of all European robot installations took place in the European Union (67,800 units).
Robot demand in Europe benefited from the nearshoring trend. The annual average growth rate from 2019 to 2024 was plus 3%.
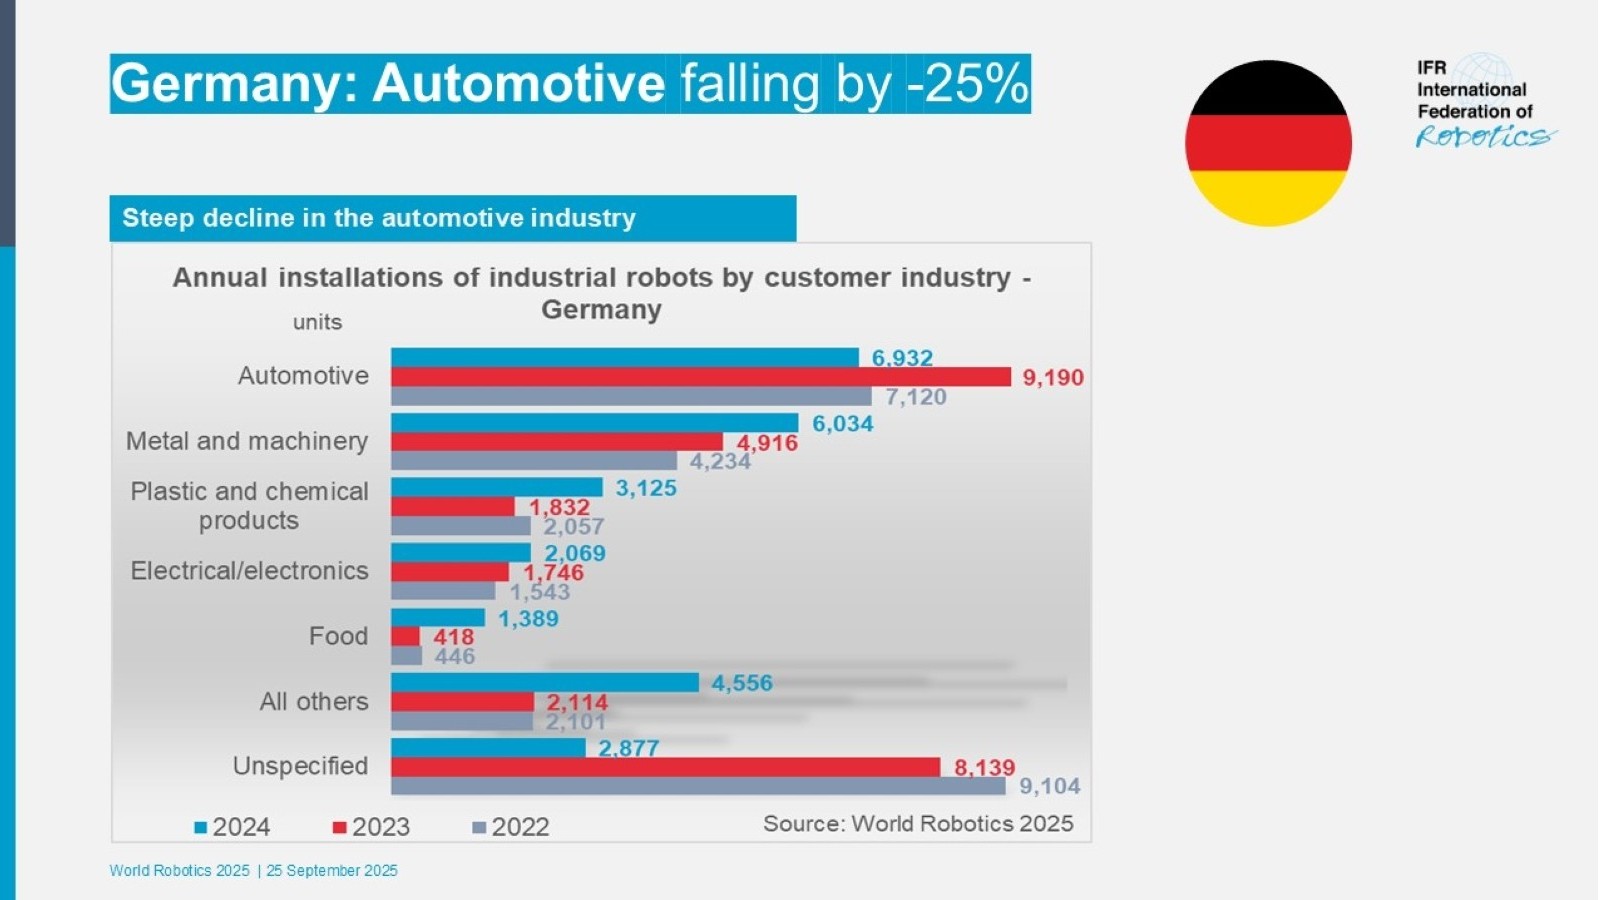
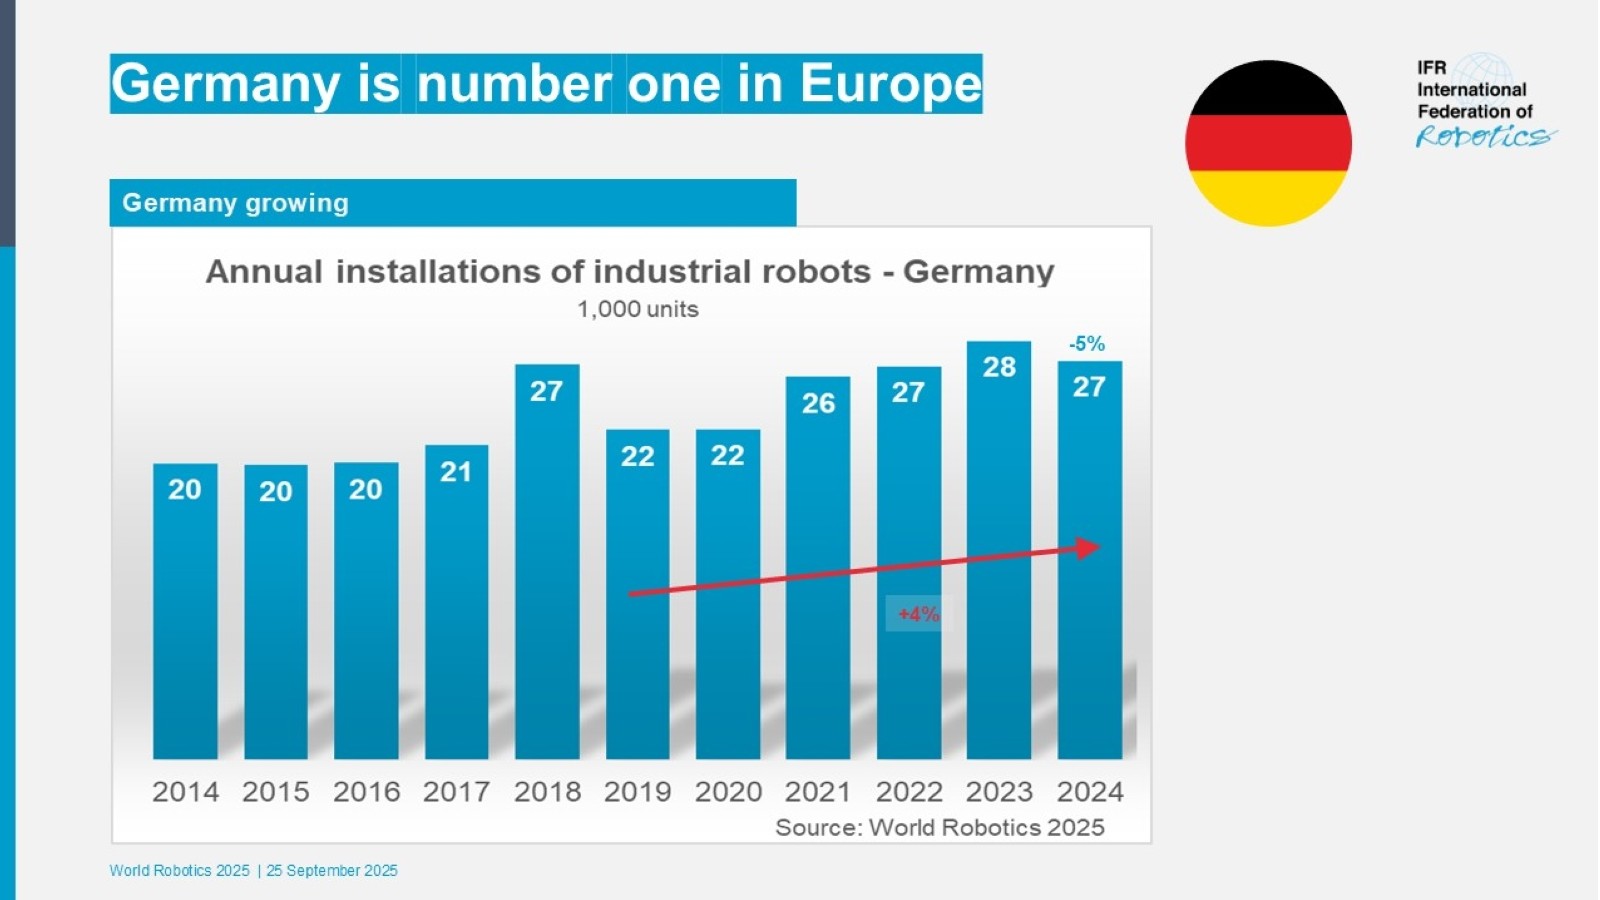
- Germany is the largest robot market in Europe and the fifth-largest in the world. Installations fell 5% to 26,982 units in 2024, which is the second-best result recorded after the record year of 2023. This represents a 32% market share of the annual total in Europe.
- The number of installations in Italy, the second largest European market, fell by 16% to 8,783 units.
- Spain is now in third place (5,100 units), with a strong demand from the automotive industry.
- France (4,900 units) moved down to fourth place, with a 24% decrease.
- In the UK, industrial robot installations were down 35% to 2,500 units in 2024.
The record number of 3,800 units in 2023 was a one-off peak,
driven by the “super-deduction” tax credit program, which ended after the first quarter of 2023.
Installation counts moved sideways with some cyclicity over the past decade. Robot installations
in the UK rank 19th worldwide in 2024.
- Robot installations in the Americas exceeded 50,000 units for the fourth year in a row: 50,100 units were installed in 2024,
down 10% below the level reached 2023.
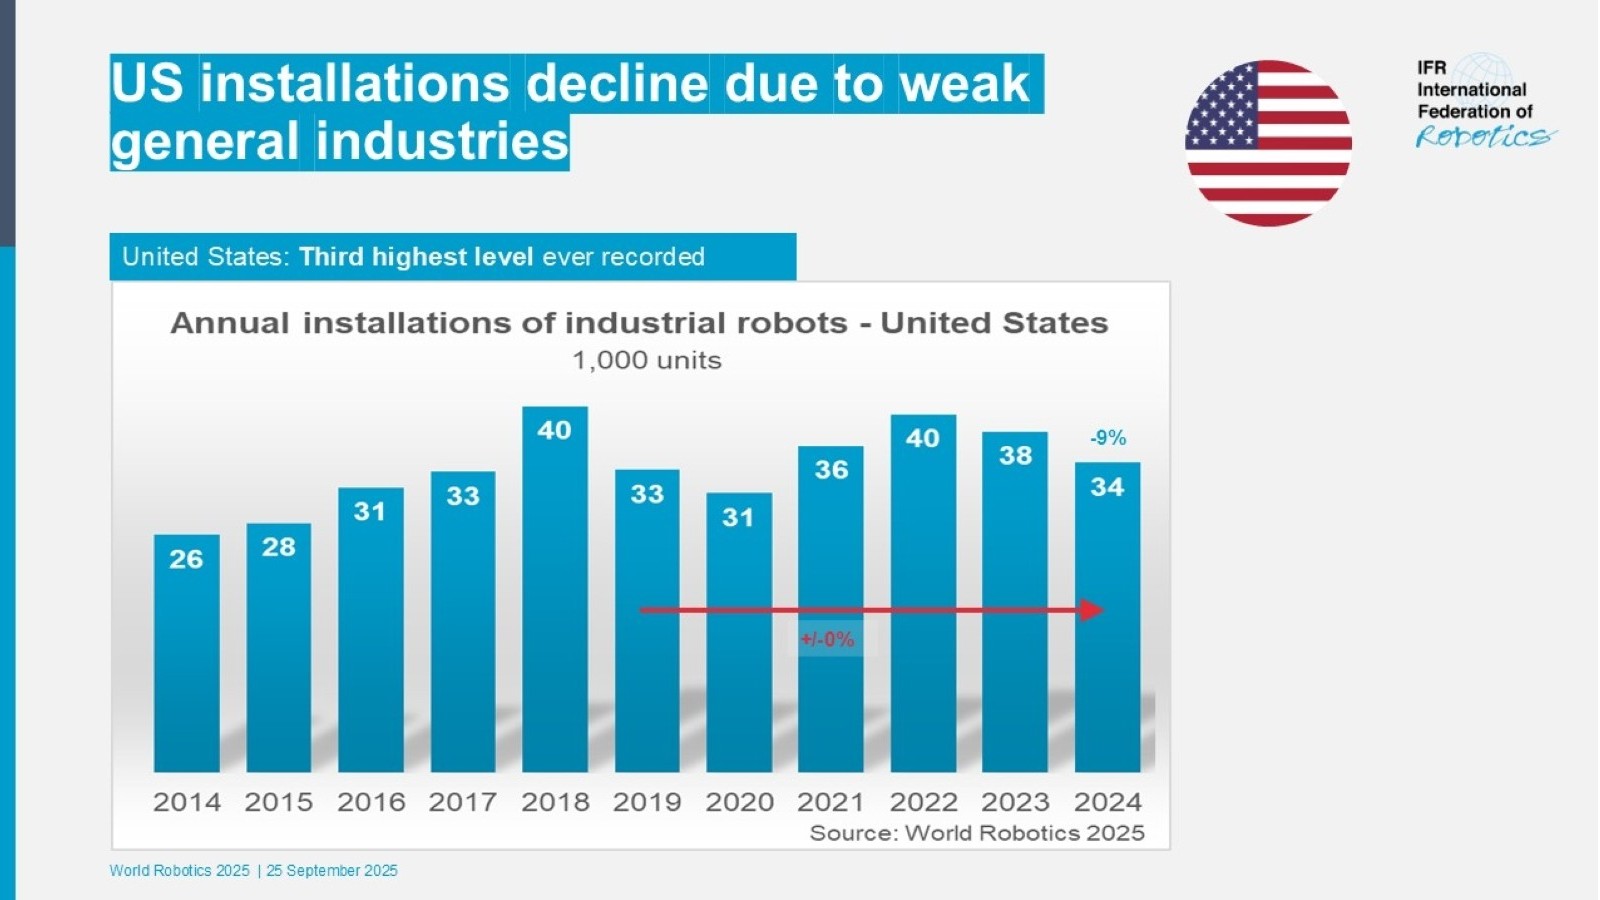
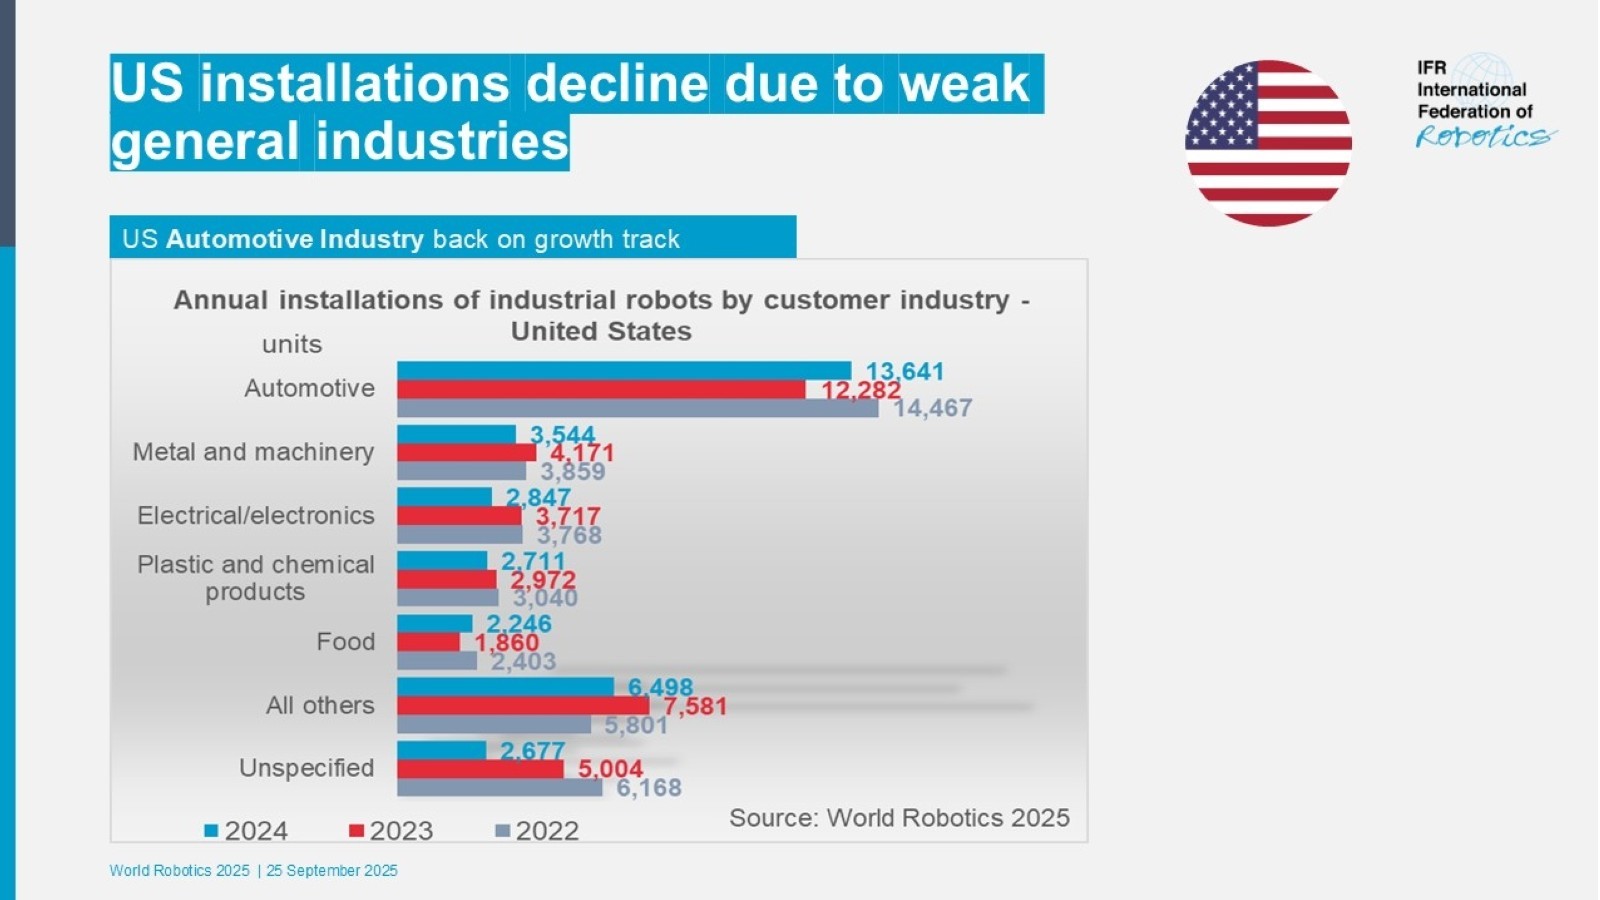
- The United States, the largest regional market, accounted for 68% of installations in the Americas in 2024.
Robot installations were down by 9% to 34,200 units. The United States imports most of its robots from Japan and Europe,
with few domestic suppliers. However, there are numerous domestic robot system integrators implementing robotic automation solutions.
- Total installations in Mexico reached 5,600 units in 2024, a decrease of 4%. The automotive industry remained the key customer of industrial robots in Mexico, accounting for 63% of the installations in 2024.
- In Canada, robot installations declined by 12% to 3,800 units. Installation figures in Canada largely depend on automotive investment cycles. The share of the car industry was 47% in 2024.
Service Robots
- The total number of service robots sold for professional use reached almost 200,000 units in 2024, marking a 9% increase.
- Staff shortages are a key driver for companies to use robots designed for trained professionals.
- The growing elderly population is increasing demand for medical robots.
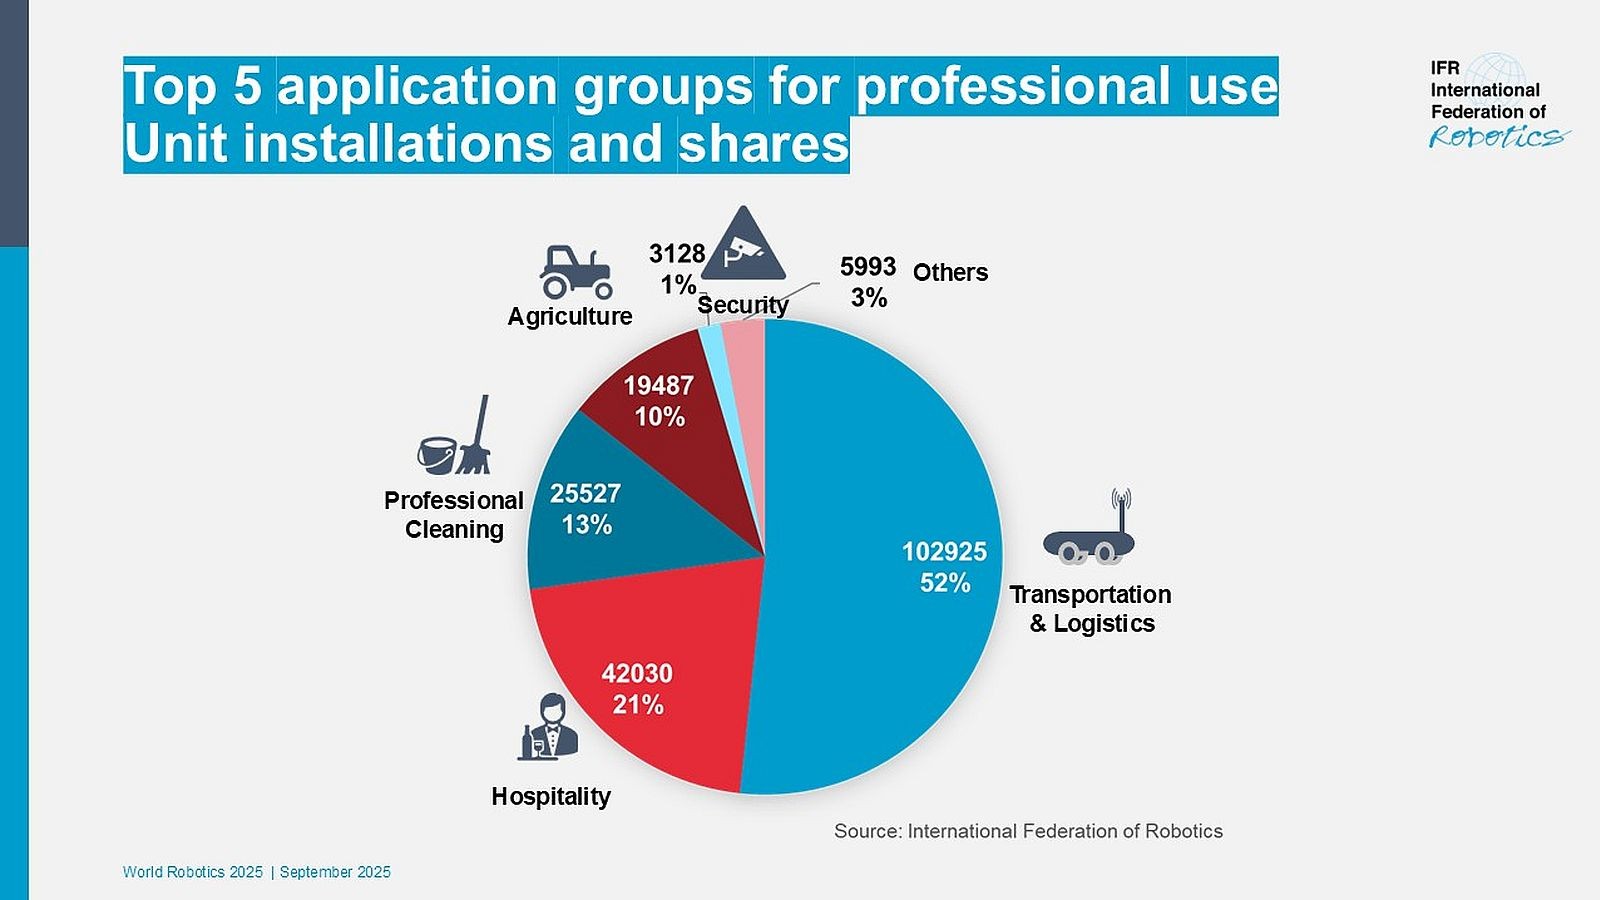
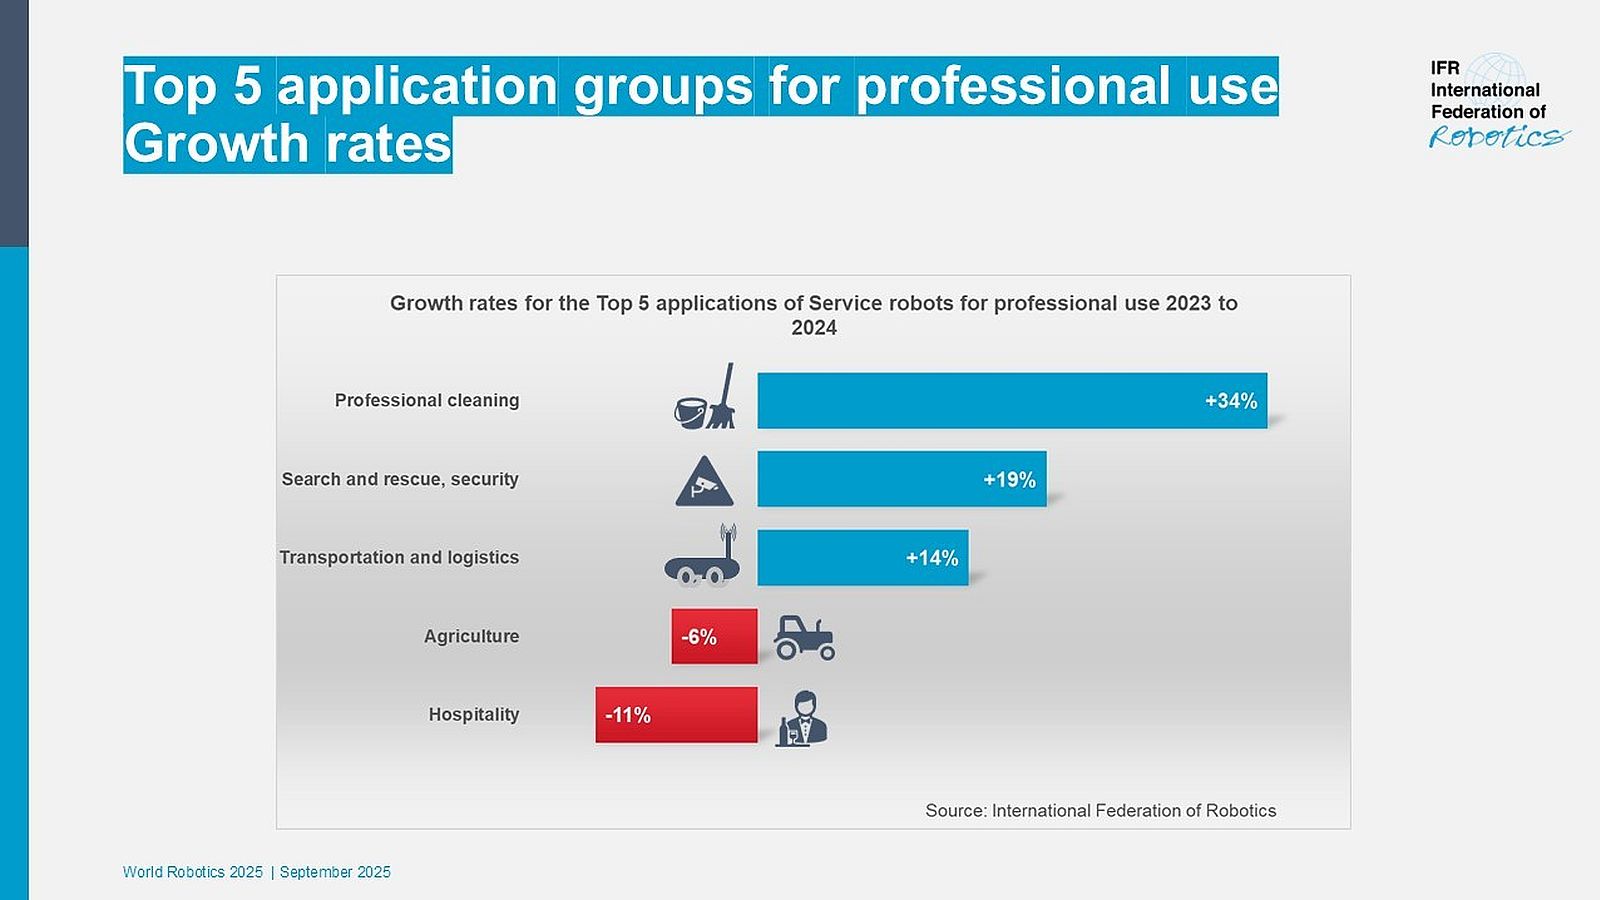
- With 102,900 units (+14%) sold in 2024, more than every other professional service robot was built for the application class transportation and logistics. These robots cover mainly mobile robots for the transport and handling of goods. While traditional sales remained the main channel of monetarization, RaaS enjoyed growing popularity with a growth rate of 42% in 2024. Transportation in indoor environments without public traffic qualifies as the most important application class within this segment. A special chapter in World Robotics 2025 focuses on the drivers and challenges in this dynamic market.
- Hospitality robots remain second place with more than 42,000 sold – down 11%. Robots for mobile guidance, information points in public environments and telepresence account for the majority of these robots. Such service robots are taking over small services or promoting sales in stores, shopping malls, or at front desks. As the sector is evolving, new applications have emerged, such as food and beverage preparation.
- The market for professional cleaning robots, in third place, grew by 34% to more than 25,000 units sold. The main application is floor cleaning.
- Sales of agricultural robots rank fourth and contracted slightly by 6% with close to 19,500 units sold. The decrease was mainly driven by cultivation and milking.
- For the application group of search & rescue, security robots a total number of 3,100 units were sold in 2024, placing it in fifth position up 19%. Three out of four robots in this application class were for security services.
In accordance with ISO standard the World Robotics 2025 yearbook considers
medical robots
as a third category alongside service robots and industrial robots:
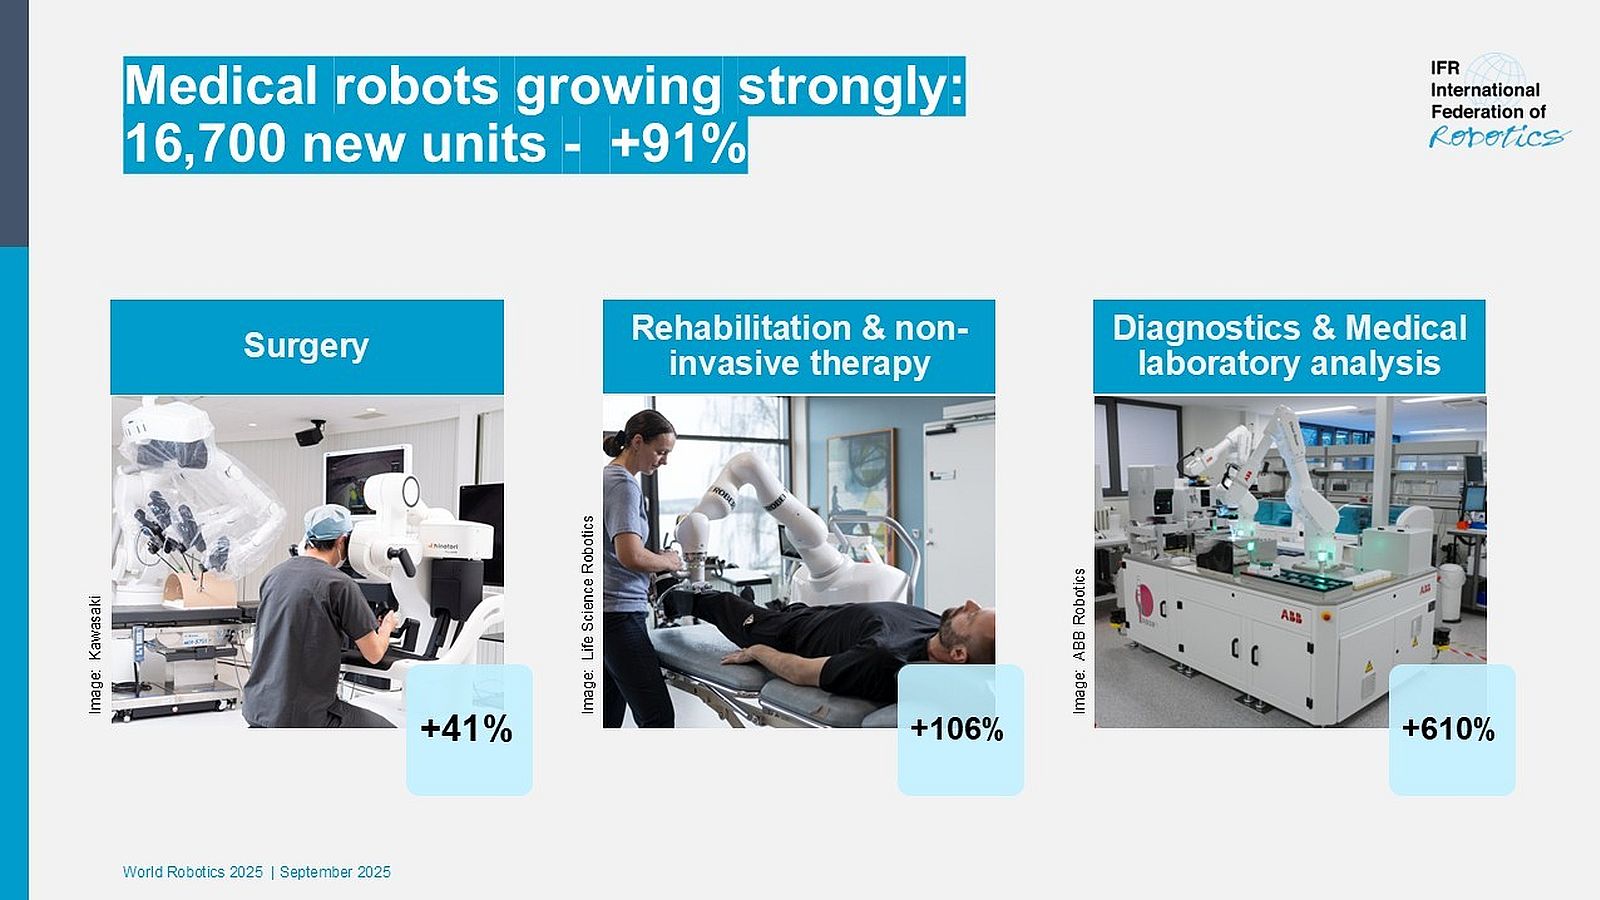
- Sales of medical robots increased strongly by 91% to around 16,700 units in 2024.
- Sales of rehabilitation and non-invasive therapy robots
were up 106%.
- Demand for surgery robots rose by 41% and sales of robots for diagnostics and medical laboratory analysis increased by 610%.
- Consumer service robots are produced for the mass market.
- Service robots for consumer use have experienced a
solid growth rate of 11% with close to 20 million units sold in 2024.
- Robots for domestic tasks (floor cleaning,
lawn moving etc.) were by far the largest group of consumer robots.
- Growth was largely driven by companies from
Europe and Asia-Pacific, which both experienced growth rates of 16%,
whereas sales from the Americas decreased by 1%.
This was due to a loss in the market share for robotic vacuum cleaners.
Note on Service Robot Data
World Robotics Service Robots is based on sample data and is not projected to the entire industry.
Sample composition varies each year. The 2025 report is based on a sample of 294 service robot suppliers.
Compiling or comparing data from different World Robotics Reports is strongly discouraged.