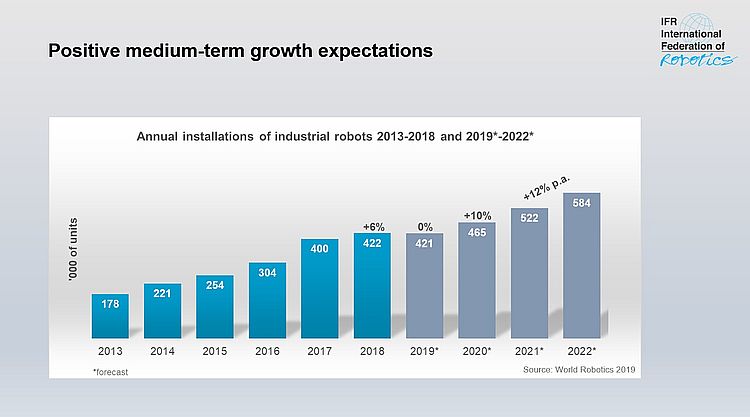
The new World Robotics report shows an annual global sales value of 16.5 billion USD in 2018 – a new record. 422,000 units were shipped globally in 2018 - an increase of 6 percent compared to the previous year. IFR forecasts shipments in 2019 will recede from the record level in 2018, but expects an average growth of 12 percent per year from 2020 to 2022.
- Chinese manufacturers gain domestic market share
- US robot installations rose by 22 percent
- Europe´s robot installations rose by 14 percent
“We saw a dynamic performance in 2018 with a new sales record, even as the main customers for robots – the automotive and electrical-electronics industry – had a difficult year,” says Junji Tsuda, President of the International Federation of Robotics. “The US-China trade conflict imposes uncertainty to the global economy – customers tend to postpone investments. But it is exciting, that the mark of 400,000 robot installations per year has been passed for the first time. The IFR´s longer term outlook shows that the ongoing automation trend and continued technical improvements will result in double digit growth - with an estimate of about 584,000 units in 2022.”
Asia, Europe and the Americas - overview
Asia is the world’s largest industrial robot market. In 2018, there was a mixed picture for the three largest Asian markets: Installations in China and the Republic of Korea declined, while Japan increased considerably. In total, Asia grew by 1%. Robot installations in the second largest market, Europe, increased by 14% and reached a new peak for the sixth year in a row. In the Americas, the growth rate reached 20% more than the year before which also marks a new record level for the sixth year in a row.
Top five markets in the world
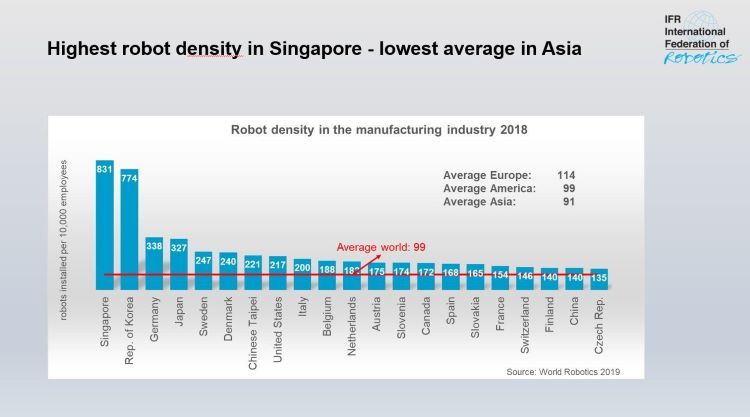
Five major industrial robot markets represent 74 percent of global installations in 2018: China, Japan, Republic of Korea, the United States and Germany.
China remains the world´s largest industrial robot market with a share of 36% of total installations. In 2018, about 154,000 units were installed. This is 1% less compared to the previous year but more than the number of robots installed in Europe and the Americas together. The value of installations reached 5.4 billion USD – 21% higher than in 2017.
Chinese robot suppliers increased their share of total installations on the domestic market by 5 percentage points (2018: 27% vs. 2017: 22%). This result is in line with China´s policy to promote domestic manufacturers. Installations of foreign robot suppliers on the other hand (including units produced in China by non-Chinese suppliers) decreased by 7% to about 113,000 units (2017: about 122,000 units). This reduction is also caused by a weakening automobile industry.
Japan´s robot sales increased by 21% to about 55,000 units, representing the highest value ever for the country. The average annual growth rate of 17% since 2013 is remarkable for a market with an already highly automated industrial production. Japan is the world´s number one industrial robot manufacturer and delivered 52% of the global supply in 2018.
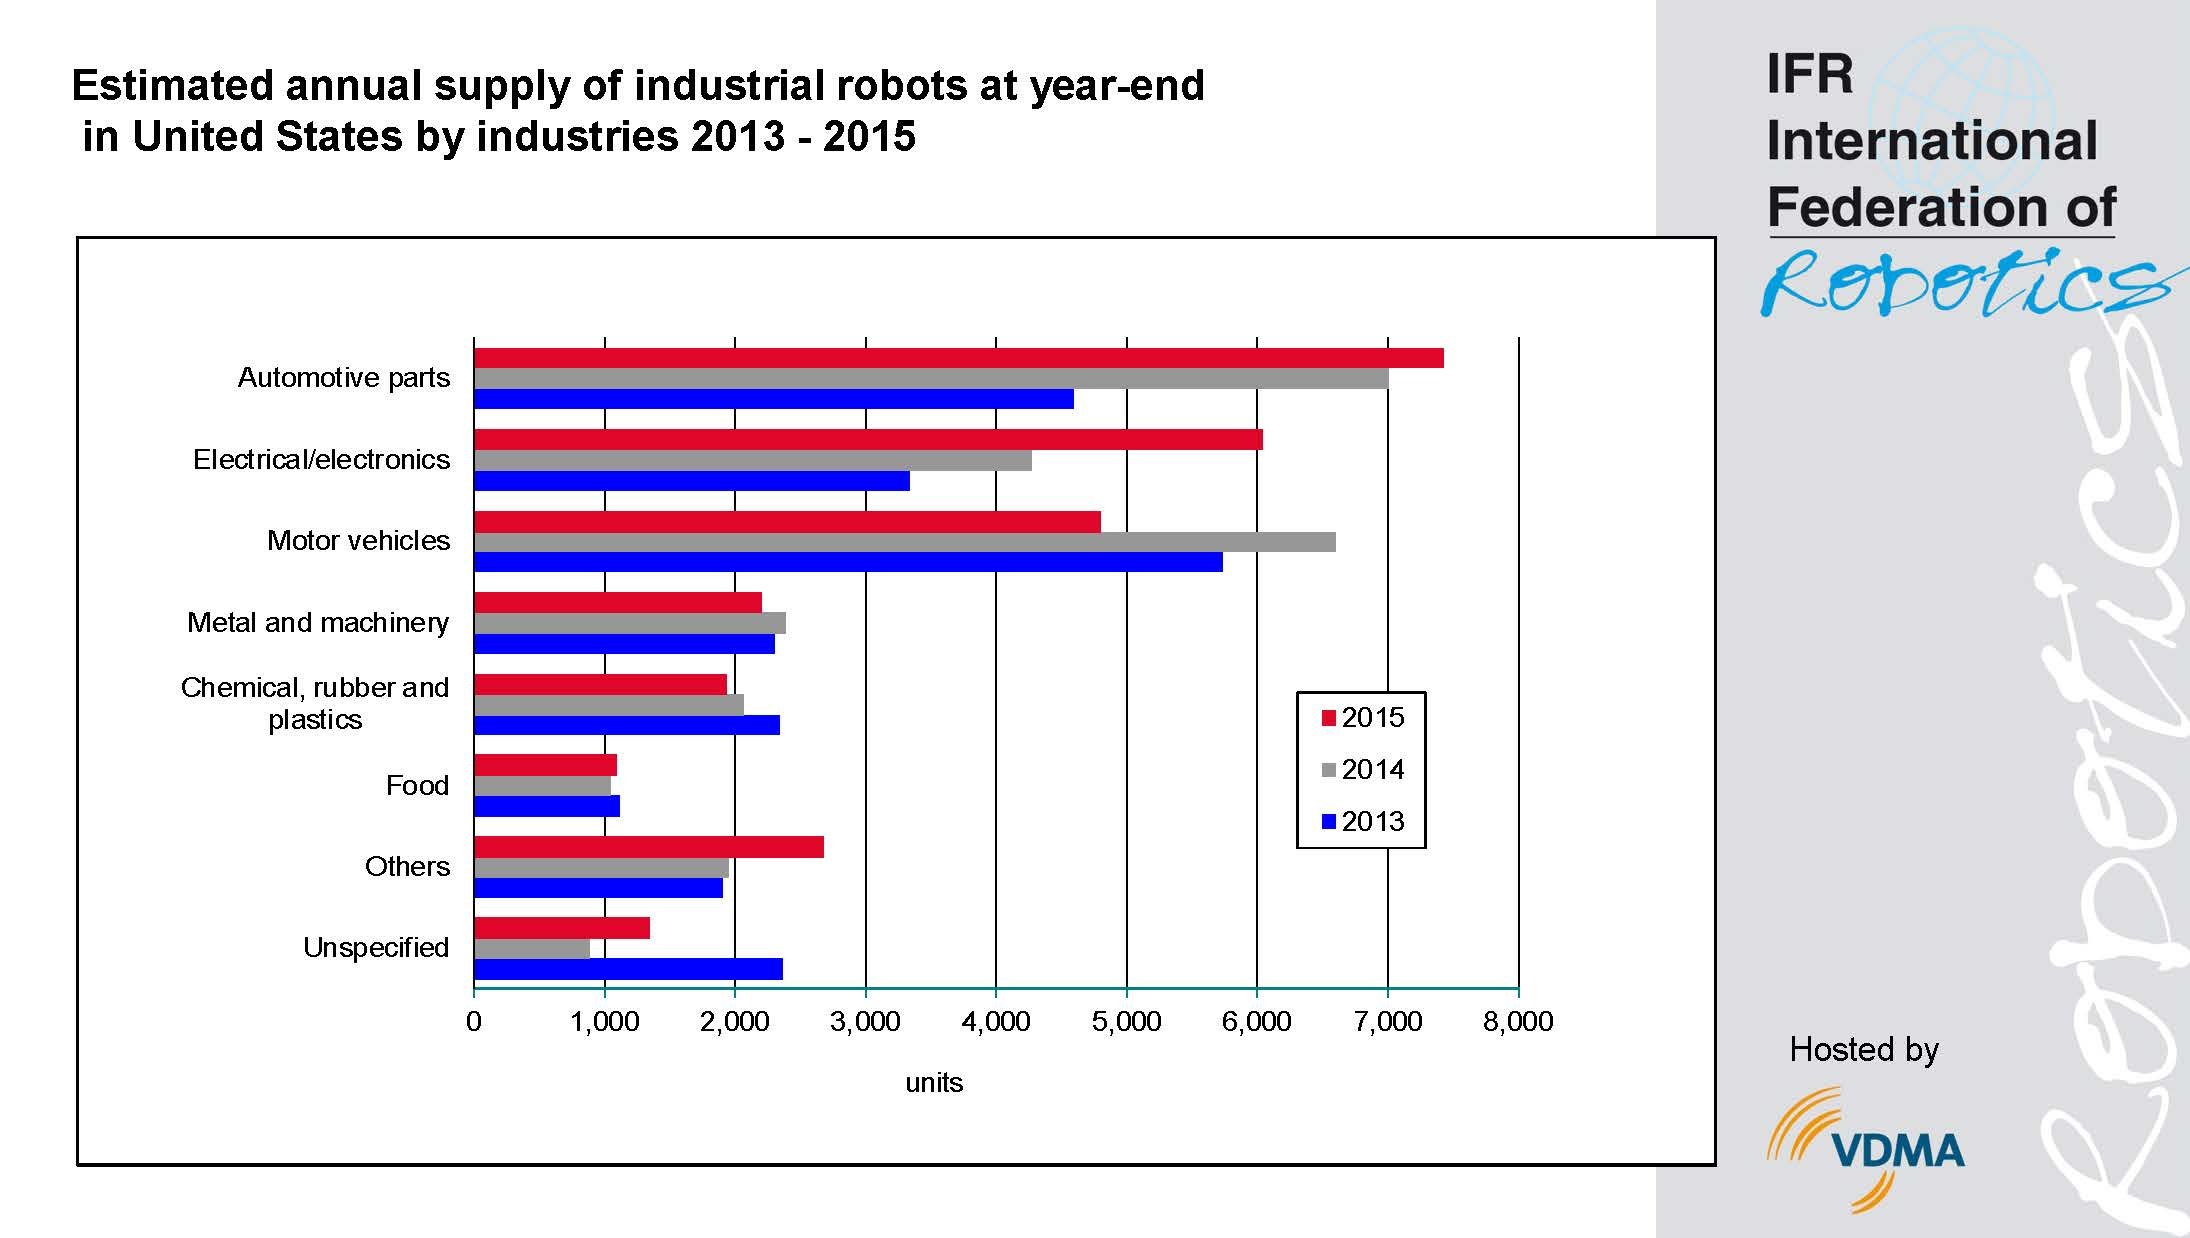
Robot installations in the United States increased for the eighth year in a row to a new peak in 2018 and reached about 40,300 units. This is 22% higher than in 2017. Since 2010, the driver of the growth in all manufacturing industries in the U.S. has been the ongoing trend to automate production in order to strengthen the U.S. industries in both domestic and global markets. Regarding annual installations, the country has taken third position from the Republic of Korea.
The annual robot installations in the Republic of Korea declined by 5% – about 38,000 units have been sold in 2018. The robot market strongly depends on the electronics industry that had a tough year. Nevertheless, installations have increased by 12% on average per year since 2013.
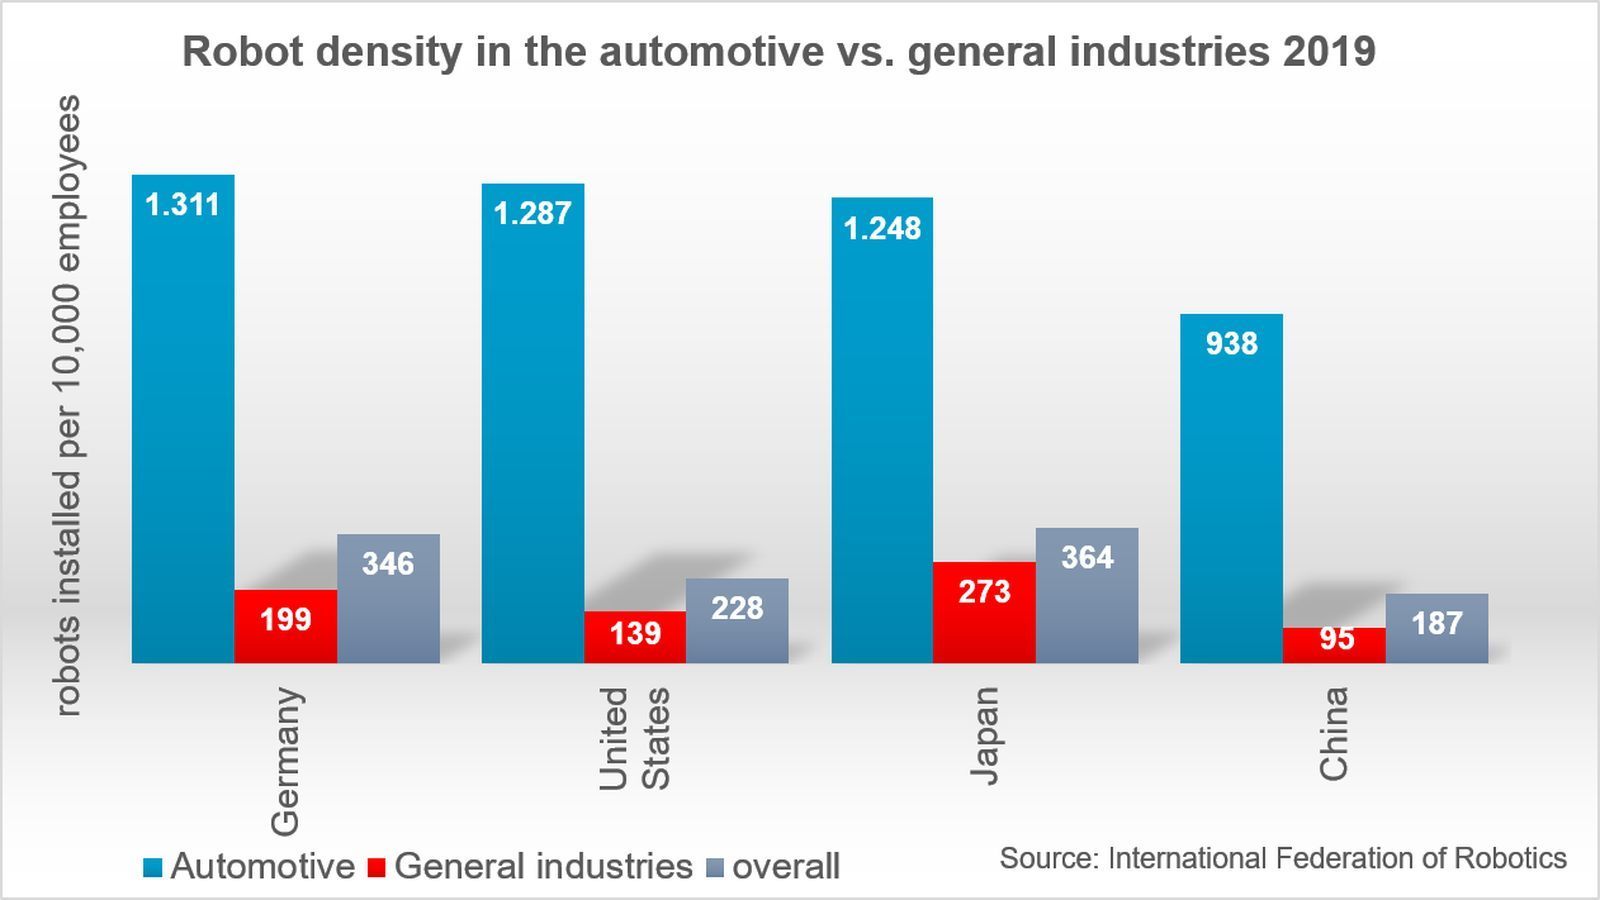
Germany is the fifth largest robot market in the world and number one in Europe, followed by Italy and France. In 2018, the number of robots sold increased by 26% to almost 27,000 units – a new all-time record. Installations are mainly driven by the automotive industry.
Robot use by industry worldwide
The automotive industry remains the largest adopter of robots globally with a share of almost 30%of the total supply (2018). After a very strong year 2017 that saw a 21% increase of installations, this level was maintained and slightly increased by 2% in 2018. Investments in new car production capacities and in modernization have driven the demand for robots. Using new materials, developing energy efficient drive systems and high competition in all major car markets pushed for investments. 79% of industrial robot installations took place in 5 key markets: China (39,351 units), Japan (17,346 units), Germany (15,673 units), the United States (15,246 units) and the Republic of Korea (11,034 units). Interestingly, India, the world’s fourth largest vehicle producer by OICA´s production statistics, had just about 2,100 industrial robots installed in its automotive industry.
The electrical/electronics industry was about to replace the automotive industry as the most important customer for industrial robots in 2017. However, in 2018, global demand for electronic devices and components substantially decreased. This customer industry is probably the one most affected by the US-China trade crisis as Asian countries are leaders in manufacturing electronic products and components. Robot installations in this industry declined by 14% from their peak level of about 122,000 units in 2017 to 105,000 units in 2018. 79% of the total installations in the electrical/electronics industry were installed in three countries with major production sites: China (43%), Republic of Korea (19%), Japan (17%). Vietnam saw a one-off boost of installations in 2017 driven by a few major projects (7,080 units), but dropped back in 2018 (689 units).
The metal and machinery industry established itself as the third largest customer industry. Installations accounted for 10% of total demand in 2018. Both producers of metal products (without automotive parts) and producers of industrial machinery, have bought substantial amounts of robots in recent years. Installations rose to about 43,500 units in 2018. This is
1% less than in the record year of 2017 (44,191 units). The metal and machinery industry was the largest customer industry in Finland (44%), Sweden (42%), Switzerland (40%), Belgium (30%), Austria (27%), Italy (26%) and Denmark (21%).
Robots designed for collaborative use (Cobots)
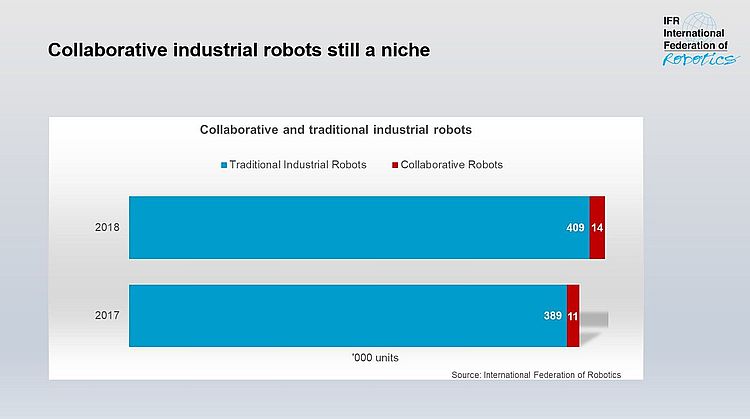
For the first time, World Robotics analyses the market for collaborative industrial robots (cobots). Cobots are designed to perform tasks in the same workspace as human workers. The IFR definition implies that a cobot is necessarily an industrial robot as defined in ISO 8372:2012. Despite a very strong media attention of cobots, the number of units installed is still very low with a share of 3.24% only. In 2018, less than 14,000 out of more than 422,000 industrial robots installed, were cobots. The year before that, roughly 11,100 units were cobots. From 2017 to 2018, annual installations of cobots increased by 23%.
Appendix
The annual global sales value of 16.5 billion USD in 2018 is a projection based on market values reported by various national robotics associations. This encompasses only the robots. If software, peripherals, and systems engineering is included, the value is approximately 50 billion USD.
Files for Download
Please find files for download below. Robot images for download in our newsroom. Further information on World Robotics, like Executive Summary etc., can be found in free downloads.
Press contact
econNEWSnetwork
Carsten Heer
Tel. +49 (0) 40 822 44 284
Email: [email protected]
See also our tweets on Twitter.
- Press Release World Robotics 2019 Industrial Robots - English (278KB)
- Pressemeldung World Robotics 2019 Industrial Robots - deutsch (283KB)
- IFR World Robotics Presentation - 18 Sept 2019.pdf (1.36MB)
- Collaborative robots 2017/2018 World Robotics 2019 share (72KB)
- Total Installations 2013_2022 WR2019 graph (103KB)
- Robot Density by country WR 2019 - graph (105KB)

